
The Ookami FAQ as it stood at the close of the project. Links on this page may no longer resolve.
Getting started and access
What is Ookami?
What is Ookami?
Ookami is a testbed for researchers nationwide to explore future supercomputing technologies and to advance computational and data-driven research on pressing science challenges.
Unique and novel features include:
- First access for US research and first planned install of A64fx outside of Japan
- First CPU worldwide with on-package high bandwidth memory (1 TB/s, 82% peak measured on STREAM triad is 8x Sky Lake socket)
- First CPU worldwide to implement the ARM scalable vector extensions with multiple features to facilitate auto-vectorization
- High CPU performance (2.76dpTFLOP/s, dgemm 94% peak) balanced to match memory speed giving ~0.4 bytes/dpFLOP is unparalleled in modern CPUs (4.6x Sky Lake, 3x NVIDIA V100)
- Green technology with high power efficiency.
What does this mean for science? Compared with the best CPUs anticipated for the deployment era, A64fx offers 2-4x better performance on memory-intensive applications such as sparse-matrix solvers found in many engineering and physics codes. For nearly all other applications performance is also better or competitive.
Getting Started Guide
Getting Started Guide
Have a look a this guide
Introduction
This guide assumes that you already have access to Ookami and that you are able to log in. It serves to get you acquainted with the environment you will be interacting with once on the system.
Basic Linux Commands
Unlike a desktop, you interact with this operating system through the terminal, sometimes referred to as the commandline. Windows and OS X both have their own version of the terminal, even though most users choose not to use them. Here, the use of the terminal is mandatory, so it is important that you know your way around it.
mkdir
When you first log in you will arrive in your homedirectory. This is your own private folder to store things related to your work. You can make subdirectories, files, and even install software here. Making a subdirectory is simple. Use the mkdir command:
mkdir <directory name>
Here, <directory name> is the name you want to give the folder.
ls and pwd
After you have done this, you can use the ls command to verify that the directory has been created without issue. Typing in ls will result in a list of files and subdirectories being printed back to you, all of which are located in your present working directory. Your working directory is the command line equivalent of your current folder in Windows Explorer or Finder - it's the directory that you're currently looking at. When you type the pwd command, your working directory will be printed out to you:
/lustre/home/<my netid>
The top-level directory, equivalent to C: on Windows, is always /lustre. The home subdirectory of /lustre contains all users' home directories.
cd
To change your present working directory, you can use the cd command, which stands for change directory.
cd <path>
You can change your directory using either an absolute or relative path. An absolute path begins with a forward-slash and specifies each level of subdirectories, starting from the root folder (which contains lustre). A relative path does not start with a forward-slash, and fills in each subdirectory level up to the directory you're currently in. For example, if you are in /lustre/home/<your username> and want to move to a subdirectory in that folder, just give cd the subdirectory name.
touch
If instead of a folder you would rather create a blank text file, you can use the touch command:
touch <new filename>
You can then edit this file with a text editor of your choice (e.g., nano, vim, or emacs).
rm
If you want to delete a file or folder, you can use the rm command (short for remove). This command will permanently delete anything you tell it to (no trash bin!). You will pass this command different options, depending on what it is you want to remove. For a regular file, you can choose not to pass it any options at all:
rm <file to remove>
However, if you want to remove an entire directory (even if it's empty), you will have to pass it the -roption (short for recursive):
rm -r <folder to remove>
This will remove everything in that directory, files and subdirectories included. The recursive option is called such because it recursively deletes everything it finds.
A word of warning - it is very easy to accidentally delete important information. Be very careful when using this command.
Most of these commands have a help or -h option. If you forget how to use a command, simply type that command followed by -h to get a description of it.
Modules
All of the commands described above are not programs, but functionality built into the shell. The shell is the program you're interacting with whenever you type something into the terminal, and is always running. In addition to these commands, the shell has a few helpful features, one of which is the existence of environment variables. These are little bits of data that all programs can access, but which go away any time you log out. Typically they are used for storing paths to directories so that programs know where to look for the files they need.
Yet another command is the env command, which lists all of your environment variables. When you type this command, you will see something like this printed to your screen:
...
COLLECTION_DATA=/data/collection
XDG_SESSION_PATH=/org/freedesktop/DisplayManager/Session0
rvm_path=/home/austin/.rvm
XDG_SEAT_PATH=/org/freedesktop/DisplayManager/Seat0
SSH_AUTH_SOCK=/run/user/1000/keyring/ssh
DEFAULTS_PATH=/usr/share/gconf/ubuntu.default.path
XDG_CONFIG_DIRS=/etc/xdg/xdg-ubuntu:/usr/share/upstart/xdg:/etc/xdg
rvm_prefix=/home/austin
...
Each line is an individual environment variable. The name of the environment variable is in all caps (e.g. COLLECTION_DATA), and its value to the right of the equals sign.
Dealing with defining these every time you log in is cumbersome, which is why we have installed a software package to simplify the process. Using the module command (a program, this time), you can load and unload environment variables that you commonly need, depending on the software you use. The module command has several subcommands that perform different functions. The most common subcommands are:
module avail
module load <some module>
module list
module unload <some module>
The load subcommand will load a module. This will make a certain software package callable from the terminal. If, for example, you load the cmake/3.22.1 module, you will be able to start CMake by typing in the command "cmake".
The list subcommand will show you a list of all the modules you have loaded since logging in.
The avail subcommand will list all of the modules that are available to be loaded. When you first log in, only a limited selection of local modules will be displayed. To view all of the software that is installed globally on Ookami, you must first load the shared module with:
module load shared
Special requests can be made to install software globally (outside of a home directory) through the ticketing system and are reviewed for notoriety of the software in question.
If you accidentally load the wrong software package or want to switch to a different version of the same software, you should use the unload command to erase the environment variables associated with that software. If, for example, you decide that gcc/10.3.0 is insufficient and want to switch to the gcc/11.3.0 release, you would first unload the gcc/10.3.0 module, then load the gcc/11.3.0 module.
Other subcommands exist. To see a list of these subcommands and how to use them, type the following command.
module help
Slurm
Now that you know the basic ways of interacting with Ookami, the next step is to understand how to use it to run computational software. Ookami has what is called the login node. Each node on Ookami is an individual computer that is networked to all the other nodes, forming a computing cluster. The login node is the entry point to the cluster and only exists as an interface to use the other nodes. Since the beginning of this guide, you have been interacting with this node. Because everybody will be on this node, it shouldn't be used for heavy computation—otherwise, the system would slow down and become unusable. To actually run heavy computation, you will have to run your software on the compute nodes.
To manage demand, we use a scheduling system called Slurm to grant you access to the compute nodes and run your job when nodes become available. All Slurm commands can only be used after loading its module:
module load slurm
Running an interactive job
Loading the Slurm module gives you access to several commands, one of which is srun. There are several different ways to use this command. To start off, we will begin an interactive job which asks for one compute node.
All Slurm commands can only be used after loading its module:
module load slurm
After loading the slurm module, you can request an interactive job with:
srun -p short -N 1 -n 48 --pty bash
In the command above, -N 1 indicates that we are requesting a single node, while -n 48 requests access to all 48 cores on that node. The --pty bash option indicates that we want to manually control a node through the terminal. The -p flag specifies which queue you want to wait in. Slurm documentation uses the word "partition" instead of "queue"; our FAQ pages will use these terms interchangeably.
After running this command you will either be waiting in the short queue or given a node immediately. This depends on the demand at the time. You can use the squeue command to show a list of jobs and their status to estimate how long you may be waiting in the queue.
Once granted access, your terminal will be interacting with the compute node instead of the login node. Here, you can test software you have installed, as you are the only user on this node and have access to all its resources.
To end the interactive job session and return to the login node, type exit.
Loading the Cray environment/modules
The Ookami cluster includes several modules comprising the Cray Programming Environment (CPE), which is aimed at providing compilers, libraries, and performance analysis tools for the ARM-based compute nodes.
In order to load the Cray environment, please do the following (Note: currently only available on the compute nodes):
module load CPE
You can use the module list command to see which modules have just been loaded. Note also that loading the CPE module makes several additional modules available (e.g., cray-based mvapich2 MPI), which can be checked with module avail.
You should now be able to use the Cray computing environment on a compute node.
Running an automated job with Slurm
Interactive jobs are good for testing your code or installed software, but should not be used for long running computational jobs since your job will end once you log off. An automated job will run until finished, and with it you won't have to retype commands all the time.
To run an automated job with Slurm, you will need to write a job script. A job script is a text file that contains all of the information needed to run your job. Your job script will contain special Slurm directives starting with #SBATCH that specify job options, like the number of nodes desired and the expected completion time. Make sure that your #SBATCH directives look exactly like the example below (no space between # and SBATCH and SBATCH is all capitalized).
Here is an example Slurm script and the example MPI program modified from the Cray Programming Environment User Guide.
(Save this as mpi_hello.c)
#include <mpi.h>
#include <stdio.h>

int main(int argc, char** argv) {
    MPI_Init(NULL, NULL);

int world_size;
    MPI_Comm_size(MPI_COMM_WORLD, &world_size);

int world_rank;
    MPI_Comm_rank(MPI_COMM_WORLD, &world_rank);

char processor_name[MPI_MAX_PROCESSOR_NAME];
    int name_len;

MPI_Get_processor_name(processor_name, &name_len);

printf (
    "Hello world from node %s, rank %d out of %d processors\n",
    processor_name,
    world_rank,
    world_size
);
MPI_Finalize();

return 0;
}
Slurm script:
#!/usr/bin/env bash

#SBATCH --job-name=mpi_test
#SBATCH --output=mpi_test.log
#SBATCH --time=05:00
#SBATCH -p short
#SBATCH -N 2
#SBATCH --ntasks-per-node=48
#SBATCH --mail-type=BEGIN,END
#SBATCH --mail-user=<your email>@stonybrook.edu

module load slurm
module load CPE
module load cray-mvapich2_nogpu_sve/2.3.6

mpicc mpi_hello.c -o mpi_hello

srun -N2 ./mpi_hello
The --job-name option gives the job a name so that it can be easily found in the list of queued and running jobs. The next lines specify the --output file, to which script results will be written, the --time that the job is expected to take (if you run without a specified time, the queues have default runtimes), the partition (-p) that the job will be submitted to, the number of nodes to use (-N 2), and the number of cores per node (--ntasks-per-node). The --mail-type and --mail-user options are not required but control whether the user should be notified via email when the job state changes (in this case when the job starts and finishes). There are many other potentially useful SBATCH options that you can set. You can read about them here, the Slurm sbatch documentation.
The next three lines load the modules required to find the software run by the script.
Note that the Slurm script for Ookami differs from MPI scripts that you may have used on Seawulf in that the command to run the compiled program is called with srun, and not mpirun or mpiexec.
Save this job submission script as mpi_hello.slurm (the ".slurm" extension is arbitrary but useful for differentiating Slurm scripts from regular shell scripts )
Make sure that you have already loaded the Slurm module, and then submit your job with:
sbatch mpi_hello.slurm
Your job will be placed in the specified queue and will run without your involvement. If you want to cancel the job at any point, you can use the scancel command, providing the number at the beginning of the job id found in the first column of the squeue printout.
Once your job has finished running, you should see a "Hello World" statement from each of 96 cores across two different nodes printed in the output file.
Checking job status
First, make sure you have loaded the Slurm module:
module load slurm
After you've submitted a job, you can check the status of your job in the queue using the squeue command. Issuing this command alone will return the status of every job currently managed by the scheduler. As a result we recommend narrowing the results by user name or job number:
squeue -j <your_job_number>
or
squeue -u <your_user_name>
Or, for a full list of options available to the squeue command:
man squeue
The documentation for all Slurm commands can be found here, the Slurm documentation.
DUO Two Factor Authentication
You are required to use DUO security to authenticate your login to Ookami. DUO provides an additional layer of security on the Ookami cluster by asking you to confirm your login attempt by accepting a push notification to your smart phone.
Please check your email for a personalized invitation allowing you to enroll with DUO. Please click the link in your email and follow this article on the DUO enrollment process. It is recommended to enroll two devices in DUO.
The Division of Information Technology offers the DUO service page, which can be referred to for additional information regarding this service.
How do I request an Ookami account?
How do I request an Ookami account?
Currently, the Ookami cluster is primarily a testbed rather than a production environment
and is best suited for software developers. Requests for production computing will receive lower priority access than testbed projects for the first two project
years.
Submitting Project Requests
To read about requirements for project requests, see How do I get a project on Ookami?
Requesting an Account
Account requests must go through https://iacs.supportsystem.com and must have an accompanying Project number.
Account requests must be accompanied by a Stony Brook NetID, which is required to access Stony Brook computing services. In the absence of a NetID, please submit a support ticket about requesting NetID credentials using the button below.
In case you got already a project number from your PI and want to be added as collaborator to an existing project, but don't have a SBU Net ID: Fill out this form and send it to "sarena dot romano at stonybrook dot edu". Then submit a ticket including your NetID and project number to get your account.
How do I get a project on Ookami?
How do I get a project on Ookami?
Since October 2022 Ookami is an ACCESS resource provider.
Existing testbed projects will still have access, though at reduced priority.
Allocation requests have to be submitted via ACCESS
Ookami can not accomodate projects from ITAR prohibited countries and restricted parties on the EAR entity list
How do I log into Ookami?
How do I log into Ookami?
Please read about the login node before using the system.
You will also need to set up DUO Authentication before using the system if you have not done so already.
Logging In
You may access the Ookami login nodes using the command line from any modern workstation via secure shell (SSH).
Linux and MacOS
In Linux of MacOSX, simply open your favorite terminal program and SSH to the Ookami login node with X11 enabled by issuing the command:
ssh -X NetID@login.ookami.stonybrook.edu
Windows
MobaXterm Home Edition, the MobaXterm download page may be freely downloaded and installed by Ookami users, as long as multiple individuals are not using the same installation. MobaXterm comes with its own X server, so no additional utilities are required to enable X11 tunneling. Login with Ookami by clicking the "New Session" button and provide the hostname (login.ookami.stonybrook.edu) and your username.
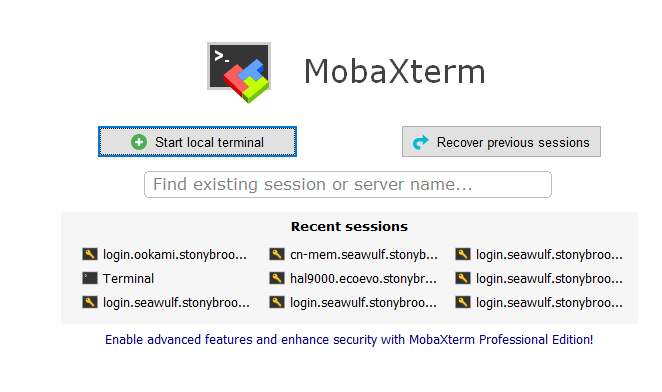
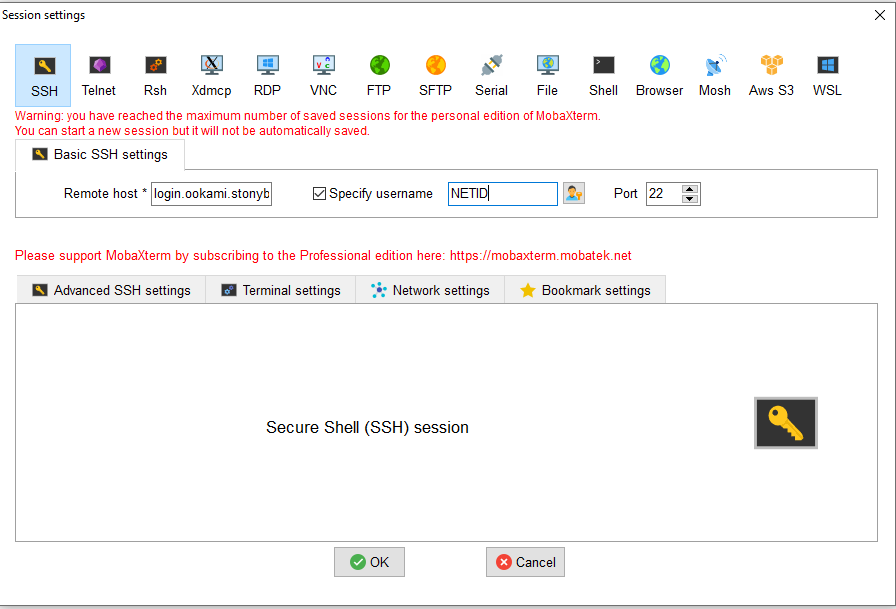
DUO Authentication
When you attempt to access the login node by following the above methods, you will receive a notification on your DUO-enrolled device. To finish logging in, please view the DUO notification and approve the log in attempt by selecting the green check mark.
If you have not already setup DUO, please refer to our FAQ page on enrolling in DUO first.
DUO_PASSCODE
You can make the DUO authentication process a tiny bit quicker if you use the DUO_PASSCODE environment variable. This will allow you to pre-select the type of DUO authentication you want to use instead of manually selecting it every time. So if you always want a DUO push to your phone, you can set DUO_PASSCODE to push, and you won't have to type '1' every time you log in. Also, this variable can sometimes fix issues with SCP/SFTP and other software used for file transfers.
Here are the possible values for the DUO_PASSCODE variable:
| Push a login request to your device. |
|---|---|
| Authenticate via phone callback. |
| Get a new batch of SMS passcodes. Your login attempt fails — log in again with one of your new passcodes. |
A numeric passcode | Log in using a passcode, either generated with Duo Mobile, sent via SMS, generated by your hardware token, or provided by an administrator. |
You can also add a number to the end of these factor names if you have more than one device registered. For example, push2 will send a login request to your second phone, phone3 will call your third phone, etc.
You can set the DUO_PASSCODE variable by appending a line to your Ookami ~/.bashrc like so:
echo 'export DUO_PASSCODE=push' >> ~/.bashrc
If this does not work, please check the caveat on our DUO and LD_LIBRARY_PATH page. You may need to change the order of commands in your .bashrc file.
Additionally, please do not set DUO_PASSCODE to sms in your .bashrc or you will be unable to log in to Ookami unless you connect through the VPN (see "VPN Access" below). The sms method of authentication will send you sms codes, but you must then set the value of DUO_PASSCODE to equal one of your one time use codes which you can't do if it's set in your .bashrc on Ookami. You can set it on the client side by modifying your MobaXTerm session configuration like so:
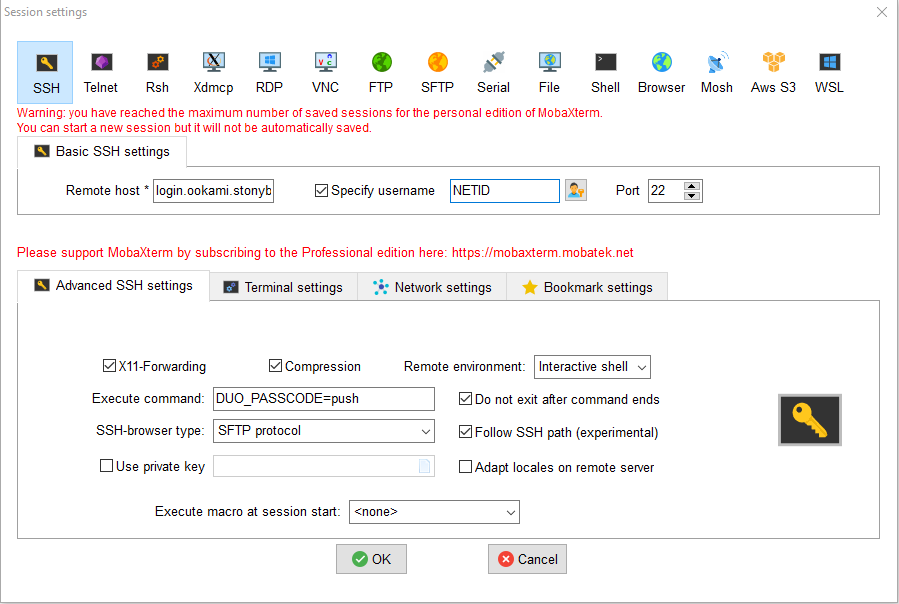
On Mac and Linux, you can modify your ~/.ssh/config file to include this setting:
Host *.ookami.stonybrook.edu
SendEnv DUO_PASSCODE
And then set DUO_PASSCODE from your terminal before you log in:
export DUO_PASSCODE=123456
VPN Access
Depending on your workflow and the software you use, you may find yourself frequently needing to authenticate with DUO. If this gets to be bothersome, consider connecting to Ookami through Stony Brook's VPN. Information about requesting access and connecting to Stony Brook's VPN can be found here, the Stony Brook VPN service page. You will need to authenticate once with DUO in order to get connected to the VPN, and then all connections made to Ookami through the VPN will not require DUO.
You may notice that the GlobalProtect VPN software refuses to close when you're done using it. GlobalProtect is designed as an enterprise-level application, primarily for use by large corporations or research institutions. Keeping the application running at all times is one of the ways that GlobalProtect ensures that all information across the network is kept secure. However, this can feel invasive when constantly running on your personal computer, so here's how to quit the program:
MacOS
Open Terminal and run this command to quit GlobalProtect:
launchctl unload /Library/LaunchAgents/com.paloaltonetworks.gp.pangp*
Then this one to reopen it:
launchctl load /Library/LaunchAgents/com.paloaltonetworks.gp.pangp*
You can add some aliases to your ~/.bashrc to make this even easier
echo "alias loadgp='launchctl load /Library/LaunchAgents/com.paloaltonetworks.gp.pang*'" >> ~/.bashrc
echo "alias unloadgp='launchctl unload /Library/LaunchAgents/com.paloaltonetworks.gp.pang*'" >> ~/.bashrc
Now whenever you open a new terminal session, you can just type loadgp or unloadgp to open and close GlobalProtect.
Windows
GlobalProtect client will restart if you attempt to kill it via Task Manager. Instead, click on Windows and type Services. Open the Services desktop app, look for PanGPS, and stop the service. Start up the service again when you want to reconnect to the VPN.
Setting Up Passwordless Access
Additionally, passwordless access is easily enabled. See How do I set up passwordless SSH? for a short tutorial.
Learning About the Login Nodes
Whenever you log into Ookami, you will be interacting with the Login Node. To understand what this is, see What is a login node?
How do I enroll in DUO Security?
How do I enroll in DUO Security?
In order to log into Ookami, you are required to use DUO security to authenticate. DUO is a two-step login application used across Stony Brook University that provides an additional layer of security for your Ookami account by asking you to confirm your login attempt via a push notification on your smart phone.
Please check your email for a personalized invitation allowing you to enroll with DUO if you have not enrolled already. Please click the link in your email and follow this article on the DUO enrollment process. It is recommended that you enroll two devices in DUO.
The Division of Information Technology offers the DUO service page, which can be referred to for additional information regarding this service.
If you have already enrolled in DUO to use other campus services, you do not need to reenroll and can accept Ookami DUO notifications with the device you are already using.
How to Reset Your Ookami Password
How to Reset Your Ookami Password
In order to change your password to login to the Ookami cluster, you must reset your NetID password through DoIT. A knowledge base article on this issue can be found here, the Stony Brook NetID service page. Note that changes to your NetID password are campus-wide and will impact other University provided services such as Blackboard, Brightspace, e-mail and Wi-Fi.
How to Fix Common Login Issues
How to Fix Common Login Issues
"Connection reset by peer"
Sometimes Ookami users receive the following error message when attempting to login:
ssh_exchange_identification: read: Connection reset by peer
This typically indicates that the IP address the user is attempting to log in from has been blocked due to too many unsuccessful login attempts.
To rectify this situation, users should submit a ticket and ask to have their IP address unblocked. When submitting the ticket it is helpful if you provide your public IP address. There are many websites that will provide this info (e.g., here, a public IP address lookup). Likewise, this info can be determined at the command line by typing "ipconfig" (Windows users), "ifconfig" (Mac users), "ifconfig" or "curl ifconfig.me" (Linux users).
The most common cause of unsuccessful logins is password mistyping. To make things easier, users may wish to bypass the need for password entry to log into to Ookami by creating an RSA key. For more info, please see this FAQ item on how to set up an RSA key for passwordless SSH.
"Your account has been locked out"
Sometimes Ookami users receive the following error message when attempting to login:
Your account has been locked out due to excessive authentication failures.
Please contact your administrator.
This occurs when you have failed to respond to 10 consecutive DUO authentication requests. You'll receive an email that will ask you to confirm the lockout. Once you respond to this email, the Computer Accounts Office will manually unlock your account. This probably happened either because your phone isn't properly configured with DUO so you never received any DUO pushes, or because you are using software or running a script that triggered a flood of DUO pushes.
If you have an iOS device, you can run a quick test to confirm that your phone is properly configured to receive DUO pushes. Open the DUO app and press "Edit" in the top left corner. Tap on your Stony Brook University account. Then click "Get Started" to perform a DUO test notificaton. If you're not using an iOS device, try logging in to the DUO Self Service Portal and make sure everything is configured properly. The HPC Support team does not provide support for DUO configuration issues, so if you run into any issues please check DoIT's DUO FAQ Page or submit a ticket to the DoIT Service Portal.
If your DUO lockout was caused by the software you're using or a script you ran, you will have to either change your workflow so that you do not get spammed with DUO pushes, or use Stony Brook's VPN when accessing Ookami. Information about requesting access and connecting to Stony Brook's VPN can be found here, the Stony Brook VPN service page. You will need to authenticate once with DUO in order to get connected to the VPN, and then all connections made to Ookami through the VPN will not require DUO. We also have some recommendations for how to transfer files to and from Ookami with minimal DUO pushes on our File Transferring FAQ Page.
Please submit a ticket to the HPC Support team if you are having trouble adapting your workflow to avoid excessive DUO pushes and the VPN solution does not work for you.
Setting up Passwordless SSH
Setting Up Passwordless SSH
RSA keys allow users to SSH into a system without having to enter a password. Instead, a locally stored key file is authenticated using the RSA cryptosystem (read more here, the Wikipedia article on RSA). This practically allows users to write automated scripts utilizing SSH login without having to compromise password security.
For MacOS and Linux
If you want to set up passwordless SSH from a Mac/Linux machine into either Ookami, you must first generate a public/private key pair from the terminal on your local machine. This would be:
ssh-keygen -t rsa -b 4096 -C "<your_netid>@login.ookami.stonybrook.edu"
The keygen program will prompt you to name the file. Give it whatever name you'd like:
Enter file in which to save the key (/home/<your_username>/.ssh/id_rsa): <filename>
The absolute path in the parentheses is the default location where the file will be saved if no filename is provided. If you provide a plain filename without an absolute path, it will save the key pair in the directory where you are running the keygen program, or whatever relative path you provide. We recommend putting your key in the .ssh folder in your home directory.
You will be prompted to create a passphrase for the key:
Enter passphrase (empty for no passphrase): <passphrase>
Enter same passphrase again: <same passphrase>
You will only need to enter this passphrase once, but it is still advisable to remember it or write it down somewhere.
Finally, add your key to your machine's list of keys:
ssh-add <private key>
You will then enter the passphrase that you created earlier. Your private key is the file without the .pub extension added to the end.
Your public key is the one with the .pub extension at the end. The next step is to upload this key to the login node:
ssh-copy-id -i <mykey> <your_netid>@login.ookami.stonybrook.edu
This will place the public key in the authorized_keys file in your .ssh directory. If the ssh-copy-id command is not available on your system, you can use the following command to upload your public key to Ookami:
cat ~/.ssh/id_rsa.pub | ssh <netid>@login.ookami.stonybrook.edu
     'cat >> .ssh/authorized_keys && echo "Key copied"'
It is best to limit permissions on your Ookami authorized_keys file. We recommend doing the following:
chmod 600 .ssh/authorized_keys
You should now be able to ssh into Ookami without entering a password.
For Windows Users
MobaXTerm
- Download MobaXterm Home Edition, a direct installer download.
- Open up a local terminal by clicking "Start local terminal"
- Then Run the command below:
ssh-keygen -t rsa
- A prompt will come up, proceed to hit enter (unless you want to add a passphrase to your private key on the second prompt)
- The output should look similar:
Generating public/private rsa key pair.
Enter file in which to save the key (/home/mobaxterm/.ssh/id_rsa):
Enter passphrase (empty for no passphrase):
Enter same passphrase again:
Your identification has been saved in /home/mobaxterm/.ssh/id_rsa.
Your public key has been saved in /home/mobaxterm/.ssh/id_rsa.pub.
The key fingerprint is:
<YOUR FINGERPRINT> hpc@login.ookami.stonybrook.edu
The key's randomart image is:
<YOUR RANDOM ART IMAGE>
- To export this key to the Ookami server, use this command below (replace <your_netid> with your NetID):
cat ~/.ssh/id_rsa.pub | ssh <your_netid>@login.ookami.stonybrook.edu
     "cat - >> ~/.ssh/authorized_keys
- Logout and close all active shells
- Open a new MobaXterm Window and click on Session on the top left corner of the screen
- Select "SSH"
- Input the remote host (login.ookami.stonybrook.edu), check the "Specify username" checkbox and input username (NetID) in the input field
- Click on "Advanced SSH Settings" and check the "Use private key" checkbox and the path should default to your saved key directory
- Select "OK" and your session should have automatically authenticated using RSA keys leaving you in your Ookami home directory.
Note: If you click to connect to a recent session of Ookami on MobaXterm, and that session wasn't configured to use your private key, it will ask for your password. Make sure you click on the most recent session for passwordless ssh or Start a new session, checking the "using your private key" box in order for passwordless SSH to work properly.
PUTTYgen and PUTTY
Download PUTTYgen.
- Open the PUTTYgen application.
- Select SSH-2 RSA and 2048 bits and click the "Generate" button.
- Move your mouse randomly in the blank area until the key generator has finished.
- If you would like to use an additional passphrase enter and confirm this on the following window.
- Save the public key and private key to a known location on your local machine.
- Copy the text from the public key to your clipboard.
- SSH into your account using PUTTY as normal (see logging in).
- From your home directory change to the .ssh directory and use your favorite editor to open the authorized_keys file and paste the key you copied into a new line
- Logout and close all active shells
- Open a new PUTTY session
- enter in the information required to login as normal
- In Connection/SSH/Auth click the "Browse" button and select the path to the private key that you saved earlier.
- Save this configuration in the Session tab and click the "Open" button
- Your session should have automatically authenticated using RSA keys leaving you in your Ookami home directory.
What are the Login Nodes?
Understanding the Login Nodes
Connecting to Ookami will now round robin users between login1 and login2 (both are ThunderX2). The login nodes provide an external interface to the Ookami computing cluster. They are for preparing submission scripts for the batch queue, submitting and monitoring jobs in the batch queue, analyzing results, and moving data. It is NOT appropriate for running computational jobs or compiling software. To do this use one of the compute queues. If necessary, you can request an interactive session by following the guide in our FAQ.
Optionally, users connect from the login node to one of the two debug nodes that have aarch64 architecture and are useful for compiling code that will be run on the compute nodes. To connect to them use ssh fj-debug1 or ssh fj-debug2. The login and the debug nodes are:
| Node Name | CPU model | Architecture |
|---|---|---|
| login1 | ThunderX2 | aarch64 |
| login2 | ThunderX2 | aarch64 |
| fj-debug1 | A64FX | aarch64 |
| fj-debug2 | A64FX | aarch64 |
If you have an account on the cluster, you can access a login node via ssh: see Logging in to Ookami.
For more information about submitting slurm jobs, see How can I submit a slurm job?
How do I use Open OnDemand to access Ookami?
How Do I Access Ookami with Open OnDemand?
Introduction
This guide assumes that you already have access to Ookami and that you are able to
log in. It serves to get you acquainted with the Open OnDemand platform you will be
interacting with once you log in.
The Ookami OnDemand can be accessed from here, Ookami's Open OnDemand instance
Open OnDemand
Via Open OnDemand, Ookami is now available from your browser allowing you to access Ookami even from your phone or tablet. There are no needs for SSH set up or SSH tunneling for Jupyter notebooks and RStudio Servers. Open OnDemand also allows users to access desktops on Ookami nodes in interactive sessions, instead of navigating through the text-only platforms.
Logging In
Use your NetID as your username and log in with your NetID Password. Once you enter
your credentials, you may be directed to DUO authentication.
The Division of Information Technology offers the DUO service page, which can be referred to for additional information regarding this service.
Ookami OnDemand
Once logged in, your screen will show the dashboard:
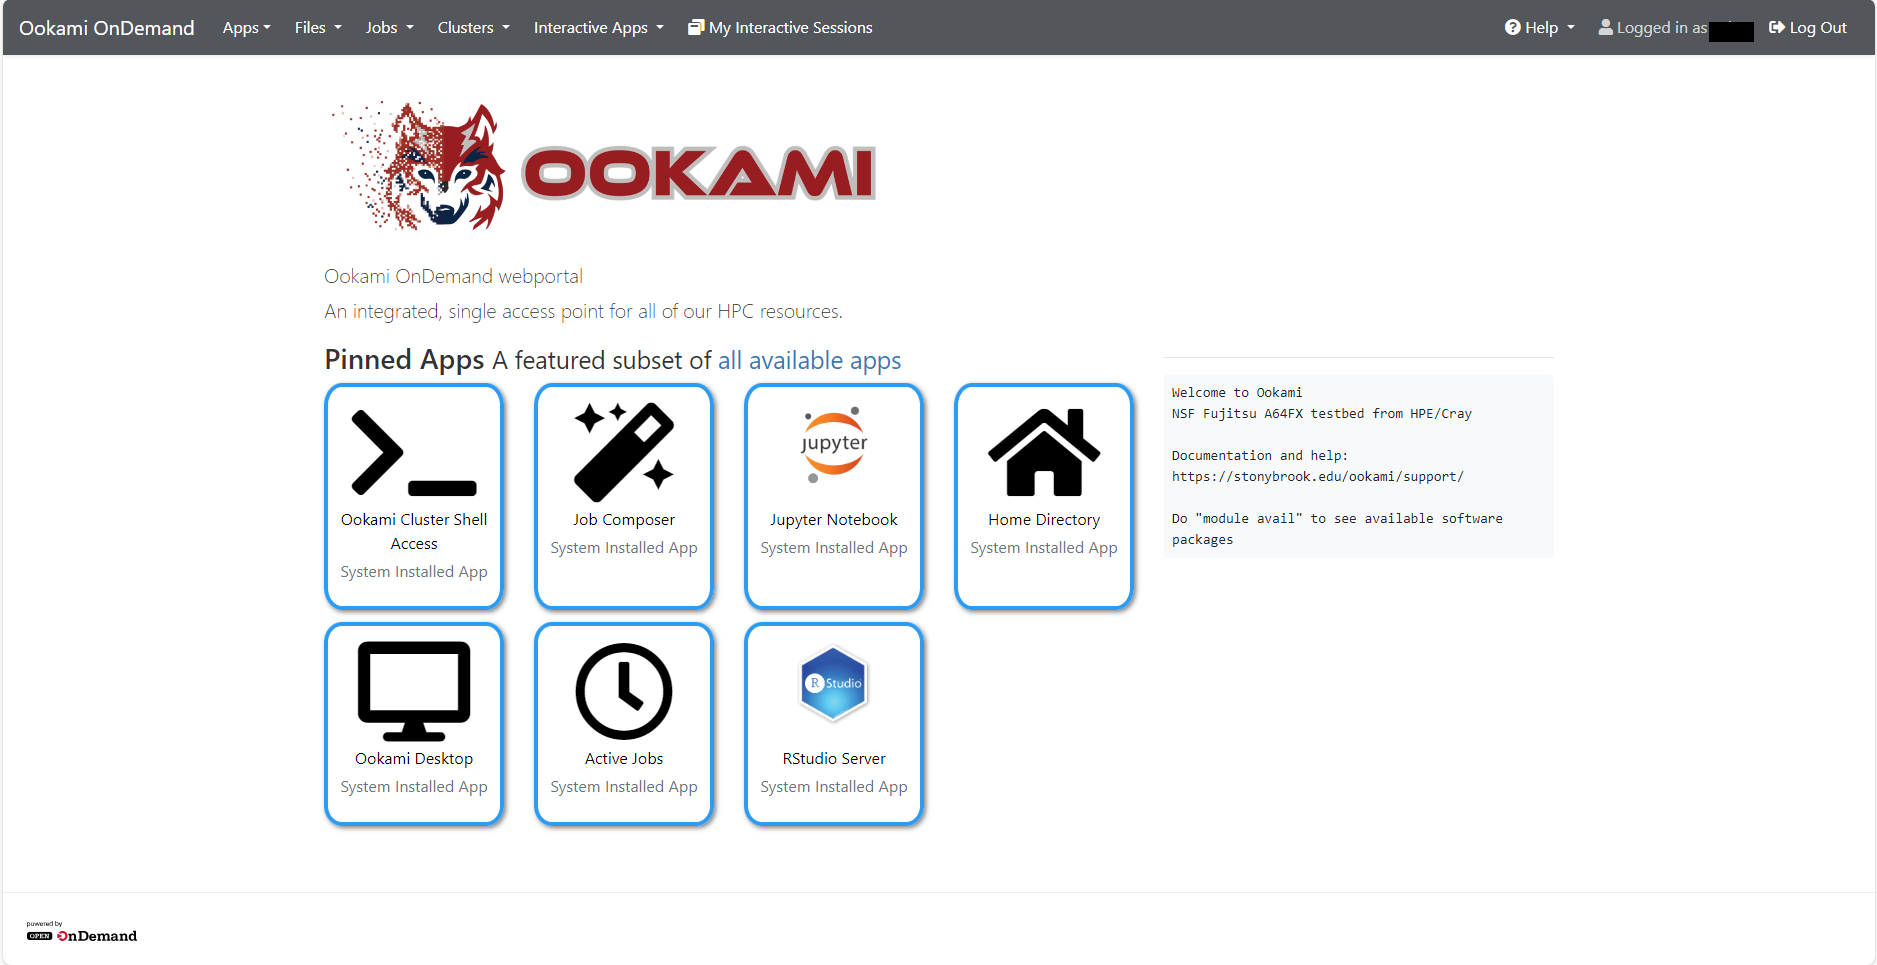
To use any apps pinned on the portal, simply click on the icons and follow the instructions
shown on the directed pages.
Below are walk-through of how to utilize some of the apps on Ookami OnDemand.
Jupyter Notebook
To use Jupyter Notebook, simply click on the icon on the main page or click on Interactive Apps on the top navigation bar and select Jupyter Notebook under Servers. You will be directed to the setting page for Jupyter Notebook.
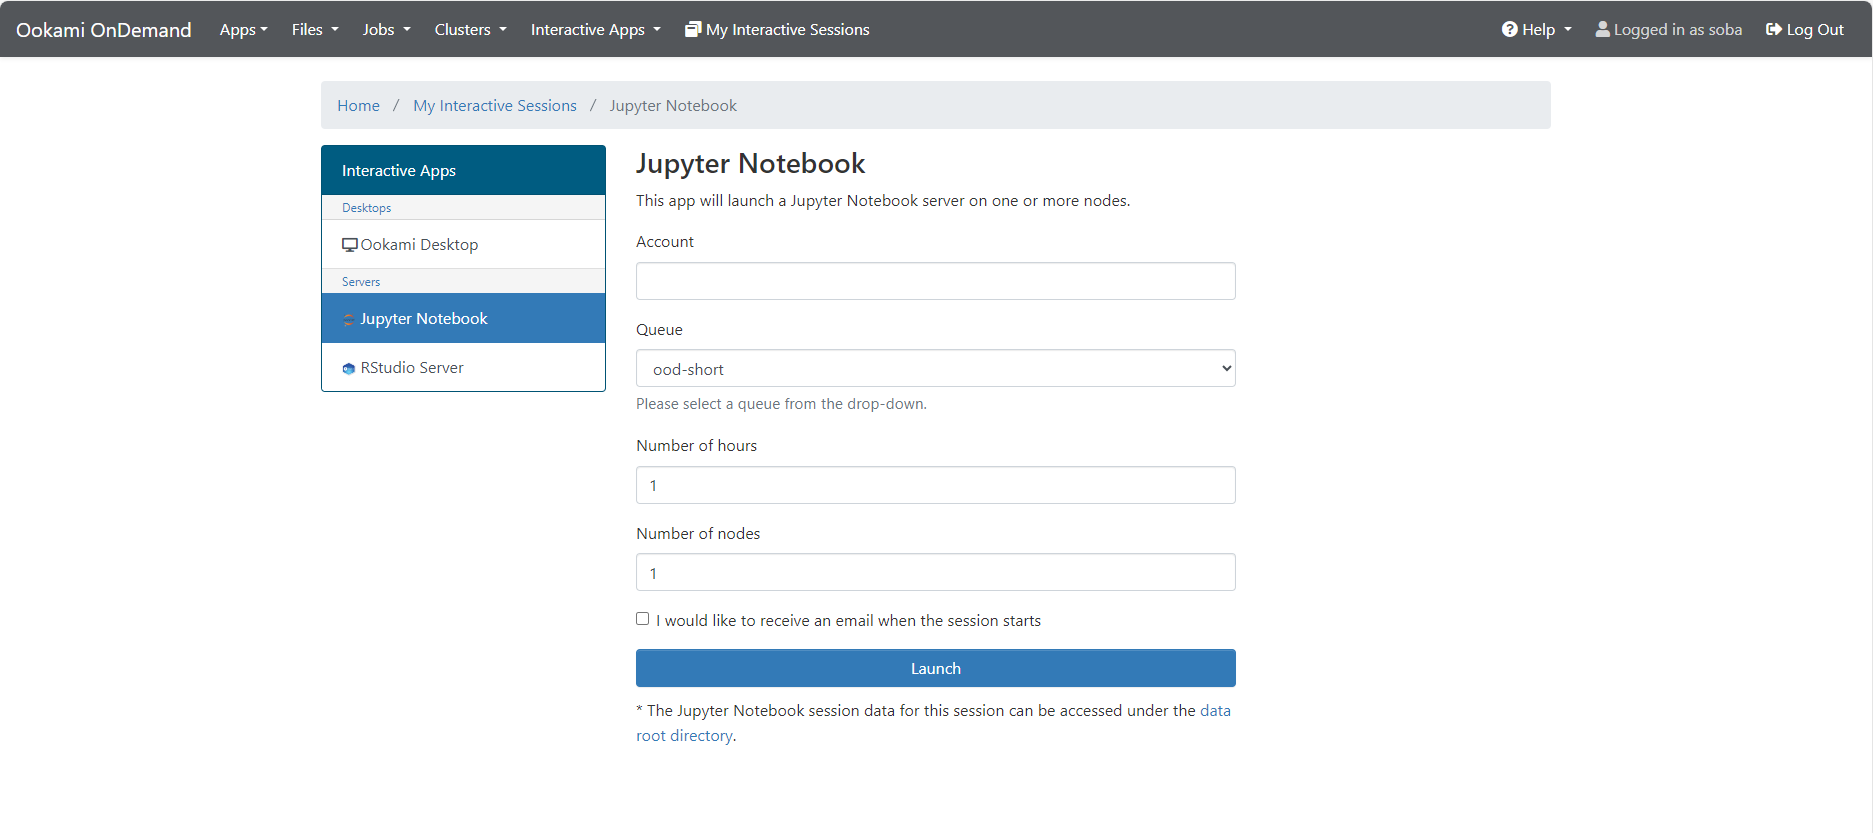
To set up the notebook, choose an appropriate queue and adjust the number of requested
hours for the session. Account field can be left blank unless there is a different
SLURM account you wish to submit the job under. Number of nodes should be kept to
1, unless using parallelization requiring more. If the waiting time is long, you can
enable email notification. An email will be sent to your Stony Brook account or the
email associated with your NetID once the session is ready.
Please keep in mind that the more resources you request, the longer you might have
to wait in queue before having resources allocated to you.
Jupyter notebook will only have access to your home directory. If you are interested in accessing files outside of the home directory, please create a symlink from that directory to home directory. For example, to create a symlink to your scratch directory, please run the following, replacing NetID with your NetID:
ln -s /lustre/scratch/NetID /lustre/home/NetID
A symlink with your NetID as the name will be created in your home directory. More information on ln command can be found by running the following on your command line: -ln --help
Once you hit Launch at the bottom of the page, you will be redirected to a status page of your allocation. It will generally be Queued, Starting, or Running.
Once your job allocated a node, the status on screen will update to Starting. Once it is ready for use, it will update to Running and a button, Connect to Jupyter, will appear as shown below. Click on it to access Jupyter Notebook. From here, using Jupyter Notebook is the same as on any other platform.
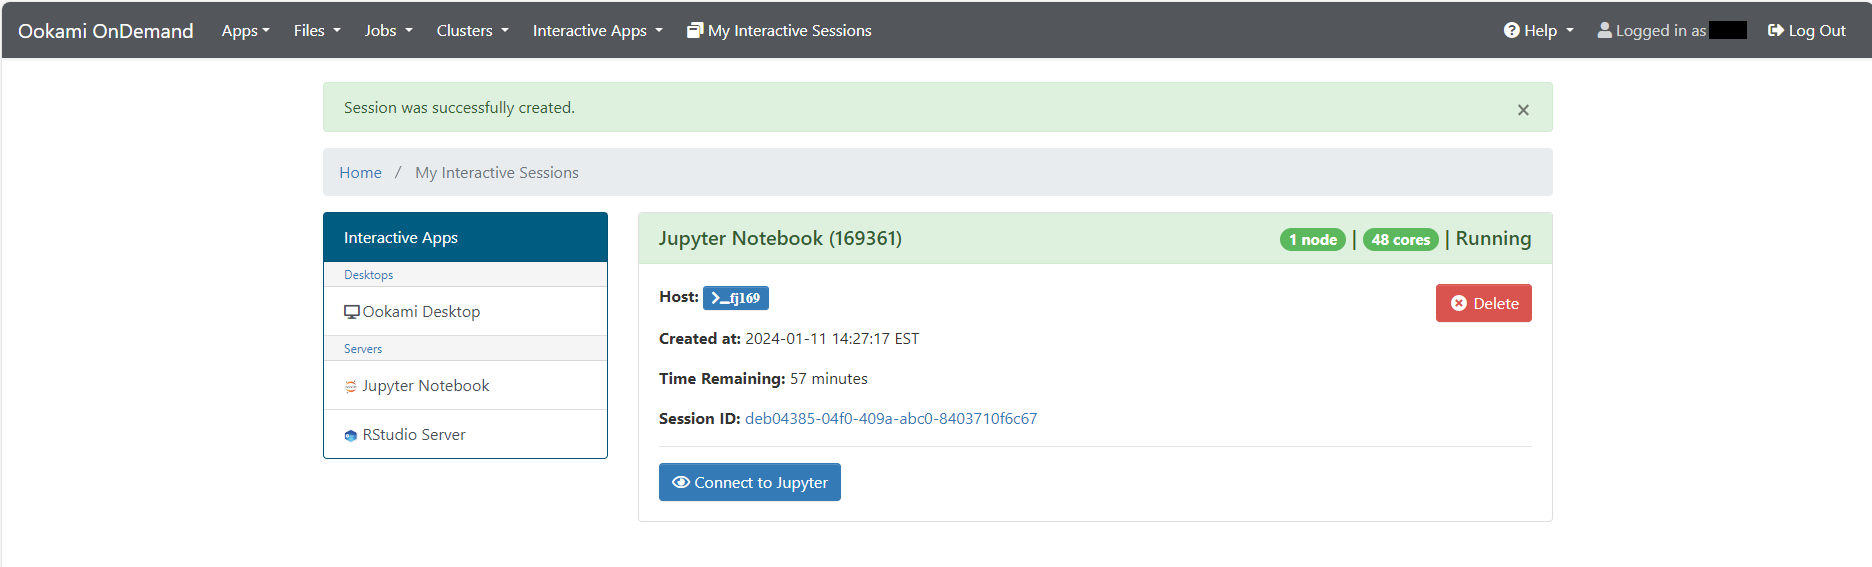
Once you are done with the session, close the tab with Jupyter and click on Delete on the status page to kill the job. Then, confirm.
The same steps can be applied to RStudio Server.
JOB COMPOSER
To run and submit an automated or non-interactive job, Job Composer can be used.
To access Job Composer, click on the icon on Dashboard or select Job Composer under Jobs on the top navigation bar. You will be directed to a Jobs setting page:
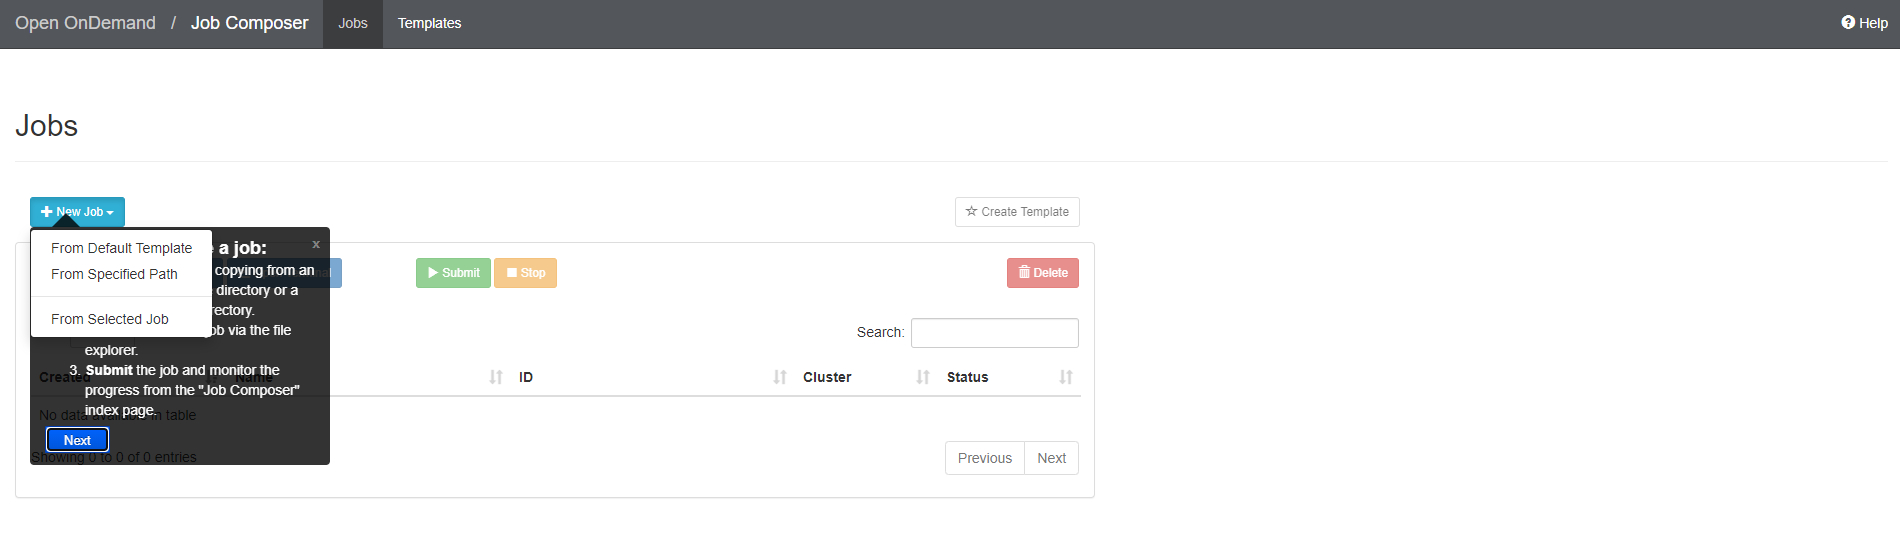
If this is your first time accessing this page, instructions to assist you will appear,
as shown above. Click on New Job at the top left corner and select one of the options. If you already have a job script
and a directory where all the necessary files are stored, selectFrom Specified Path. Provide the source path and hitSave. The optional information can be edited by clicking onJob Options once you return to theJob Composer main page. By selecting From Default Template, a new job utilizing MPI will be created on the list, and a setting column will shown
as below: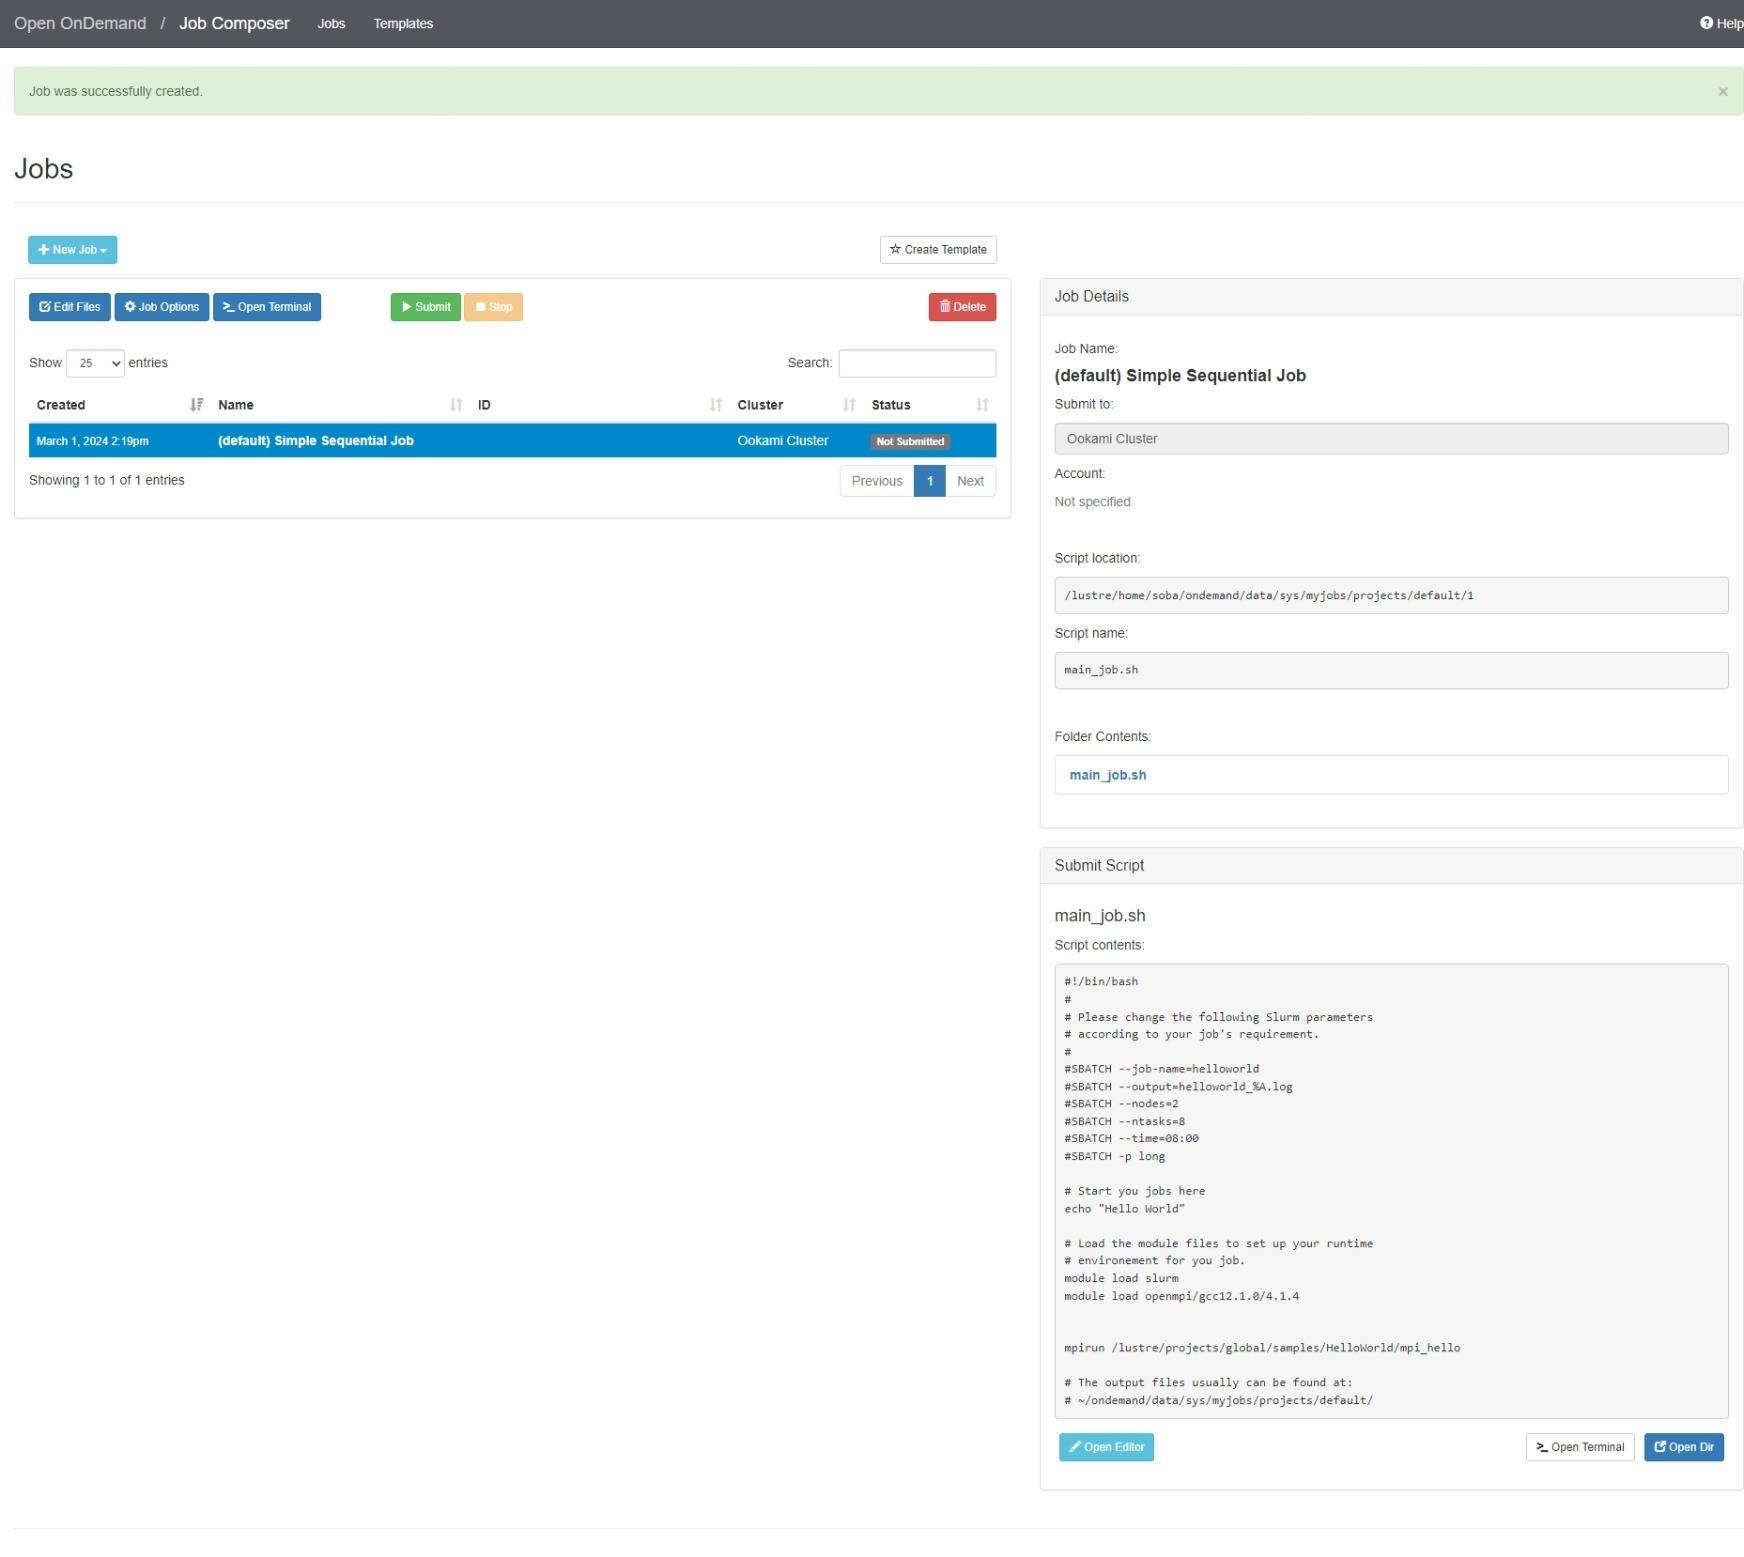
To change the content of the script file, click on the file name of the script under Folder Contents or the Open Editor at the bottom of the page. A text editor will open in a new tab as shown below. Make
changes to the file as you would format any job script. Settings such as text size,
theme, and mode can be changed on the navigation bar on the top right. Once you are
done editing, click on the Save button at the top left to save. The changes will be saved and reflected on the applicable
files stored on Ookami.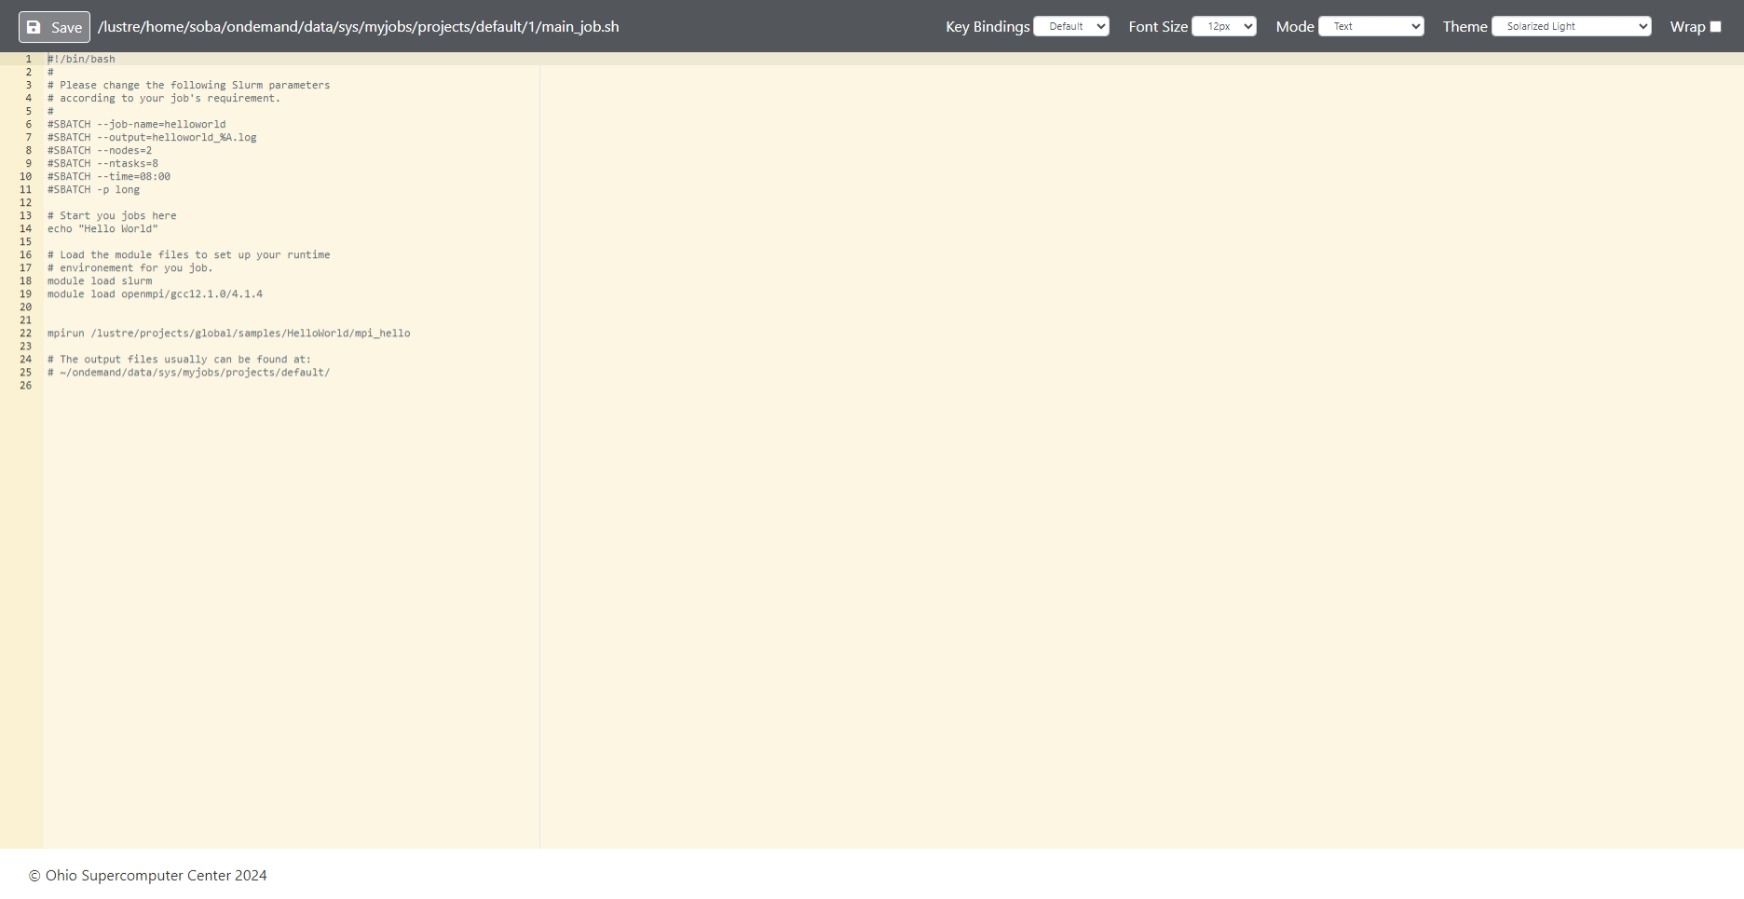
There are two ways to edit the directory and its contents from the Job Composer. You can click on the white Open Terminal button at the bottom right of the page to edit the directory from a terminal. A new
tab with a terminal with the initial directory as the specified directory for your
job will open. Please note that you may need to authorize a DUO notification before
accessing.
If you prefer a graphic interface, click on the blue Edit Files button at the top left of the page or the blue Open Dir button also at the bottom right of the page. A new tab will open as below: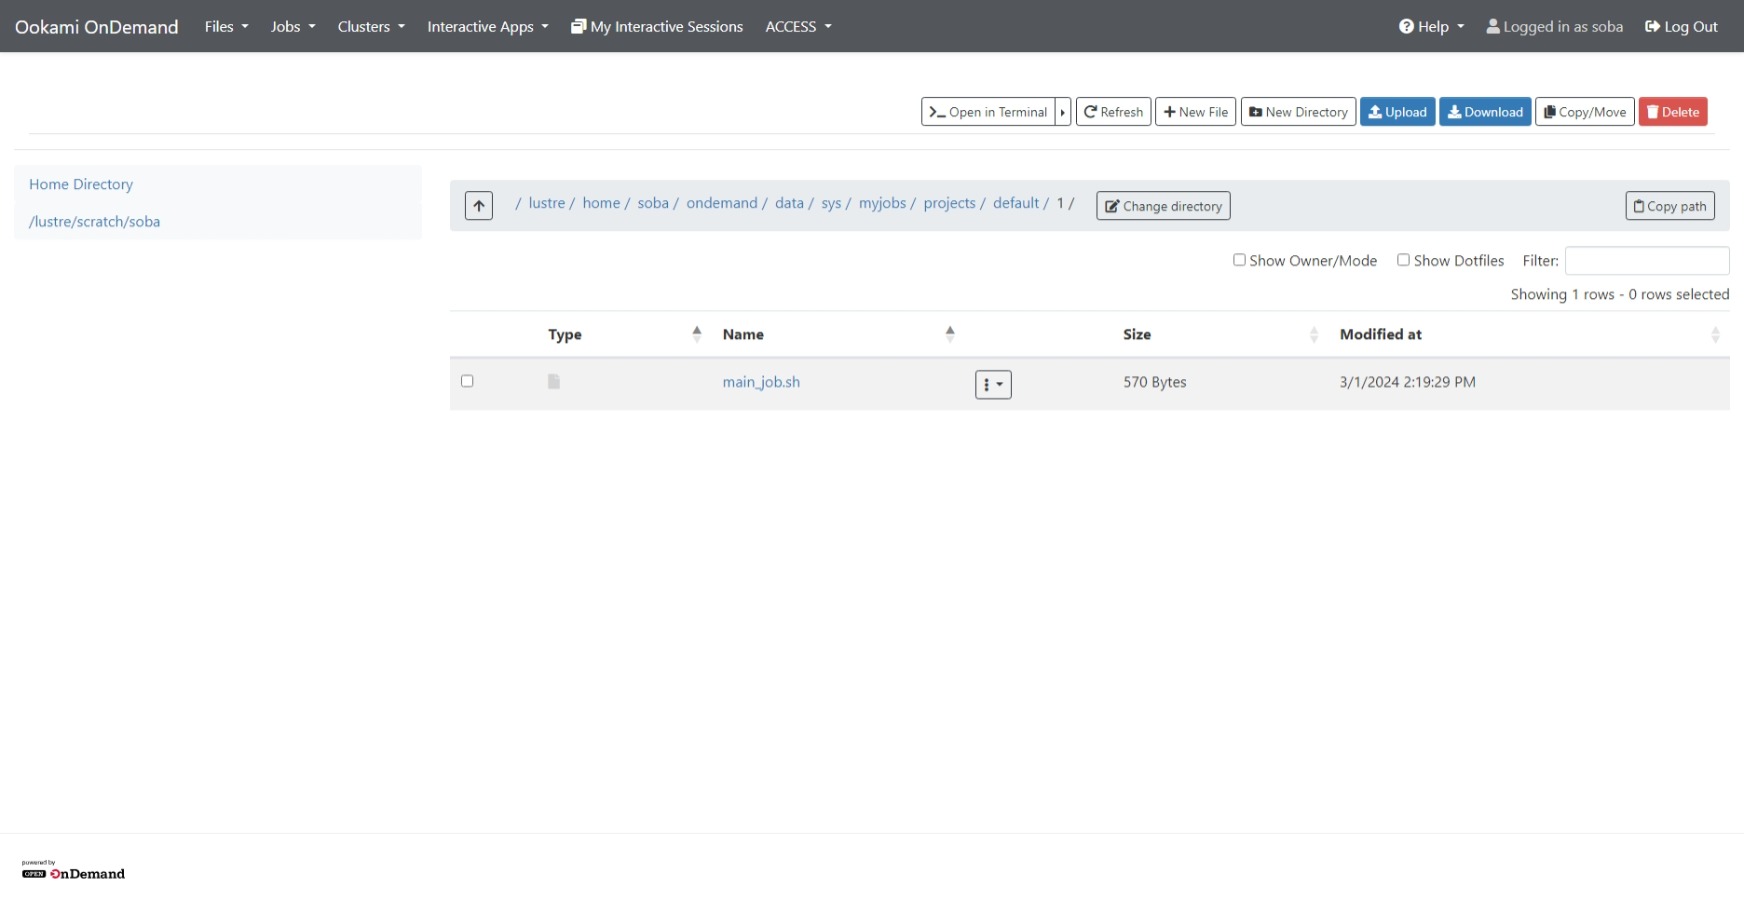
From here, you can manipulate the contents of the directory by creating new files and directories, uploading and downloading files to and from the machine you are connecting to OnDemand with, and selecting a file to copy or move from the directory. To access this page, you can also click on theHome Directory icon on the Dashboard or click onHome Directory underFiles on the top navigation bar. This page can be opened for any directory in your Ookami account by changing the source path at the clicking on the Change Directory button in the middle of the page.
Once the directory and the script is ready to go, go back to the Job Composer main page and click Submitat the middle of the page. To pause a job, click on Stop. To delete a job from the job list, click on Delete.
Running an Interactive Job
To run an interactive job aside from Jupyter Notebook and RStudio Server, Ookami Desktop or Ookami Cluster Shell Access can be used.
Ookami Desktop
To access the Desktop version of Ookami nodes, click on the icon on Dashboard or select
Ookami Desktop under Interactive Apps on the top navigation bar. You will be directed to a Ookami Desktop setting page: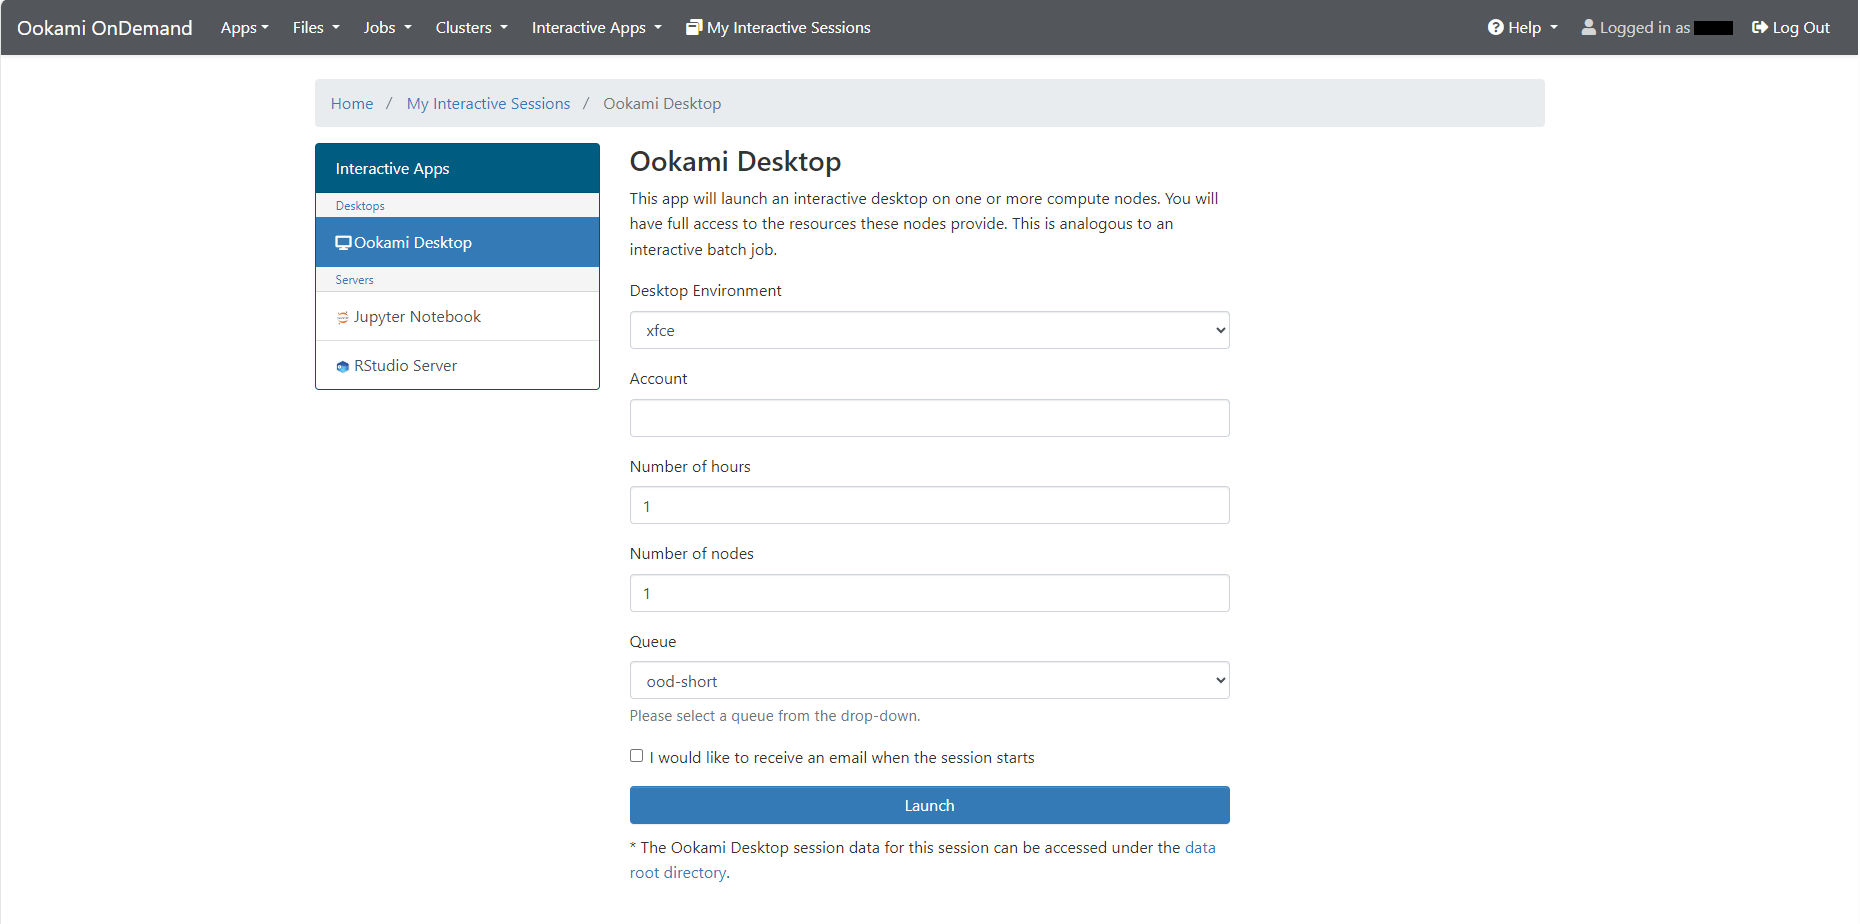
To set up your job, choose an appropriate queue and Desktop Environment for the job and adjust the number of hours you would like the session to last for. Account field can be left blank, unless there is a different SLURM account you wish to submit the job under. Number of nodes should be kept to 1, unless utilizing parallelization requiring more. If the waiting time is long, you can enable email notification. An email will be sent to your Stony Brook account or the email associated with your NetID once the session is ready.
Please keep in mind that the more resources you request, the longer you might have to wait in queue before having resources allocated to you.
Once you click on Launch, the page will refresh to show three general status: Queued, Starting, and Running.
Once the job is running, a page like below will show. From here, you can launch the
Ookami Desktop, adjust compression and image quality, and retrieve view only share-able
link.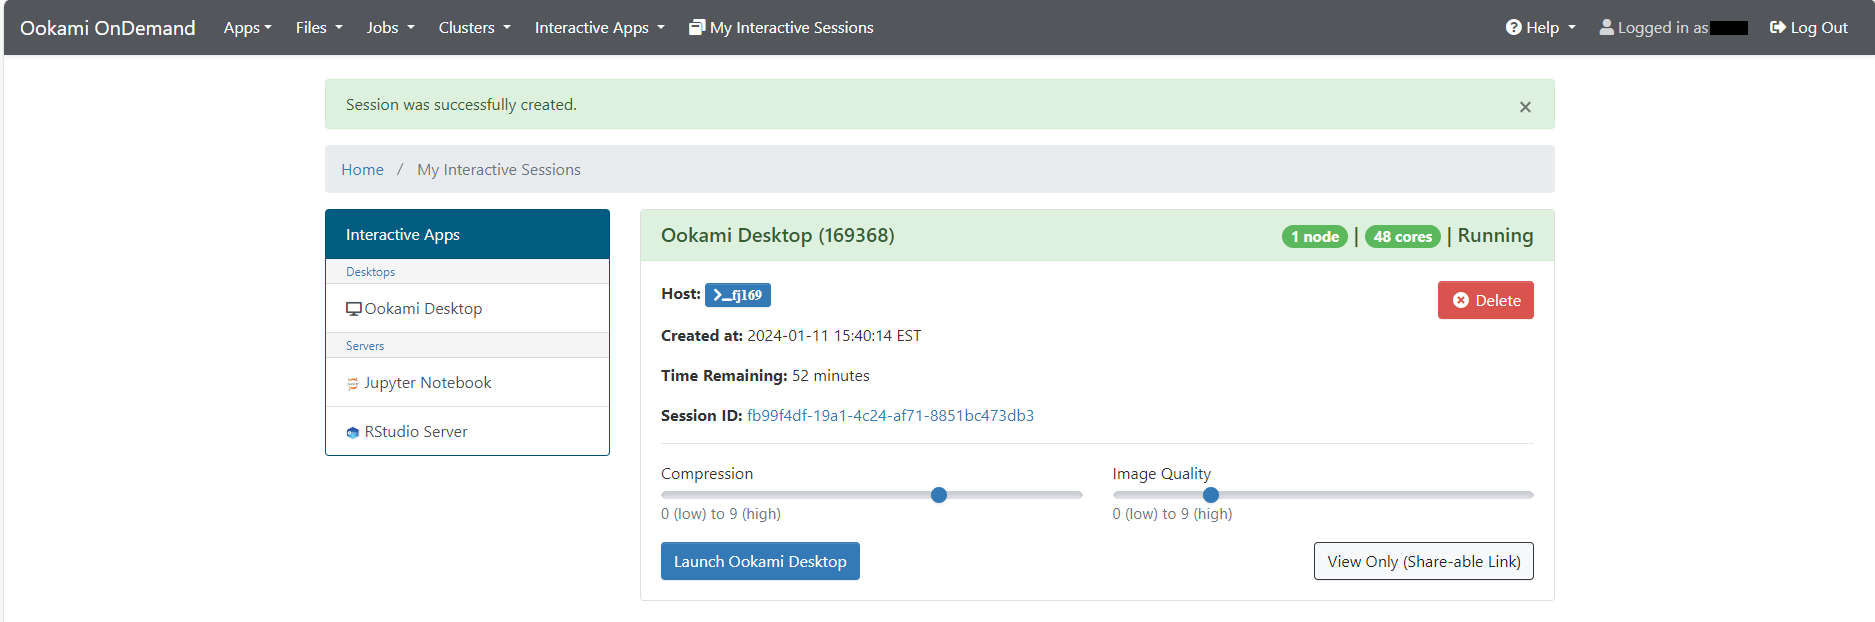
With the share-able link, anyone with an Ookami account can view your Ookami desktop from their browser and copy contents shown.
Once you Launch Ookami Desktop, you may be prompted to enter your password under your name. Simply type in your
NetID password to unlock. Then, a new tab showing a Linux Desktop where you can interact
with will open.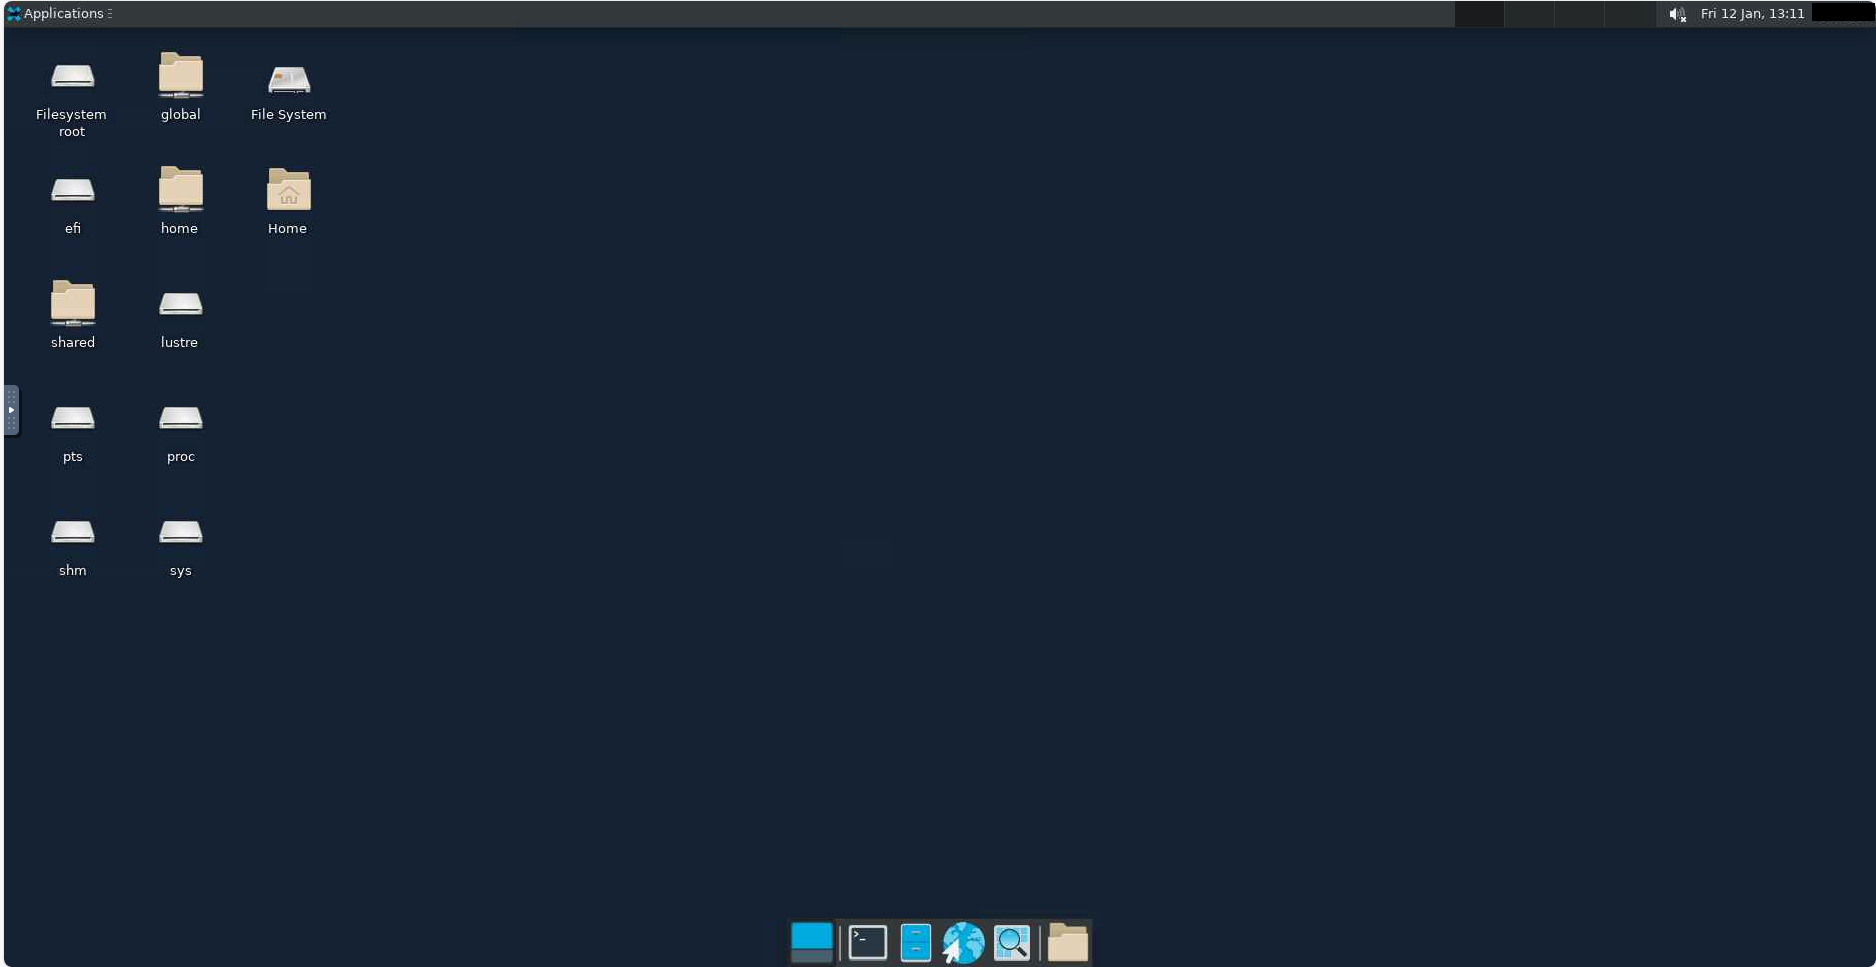
To access the command line, double click on the black icon at the bottom of the page or select Terminal Emulator under Applications on the top navigation bar.
When you are done, close the tab, click on delete on the status page, and confirm on the pop-up window.
Ookami Cluster Shell Access
To access the terminal or shell, use the Ookami Cluster Shell Access by clicking on the icon on the main page or clicking on Clusters on the top navigation bar and selecting Ookami Cluster Shell Access.
You will be directed to a shell, where you will be prompted for your DUO authentication.
After approving the prompt, you will be able to use the terminal as if you are accessing
Ookami from your terminal via SSH. You will be able to request interactive job sessions
as you would do outside of Open OnDemand. 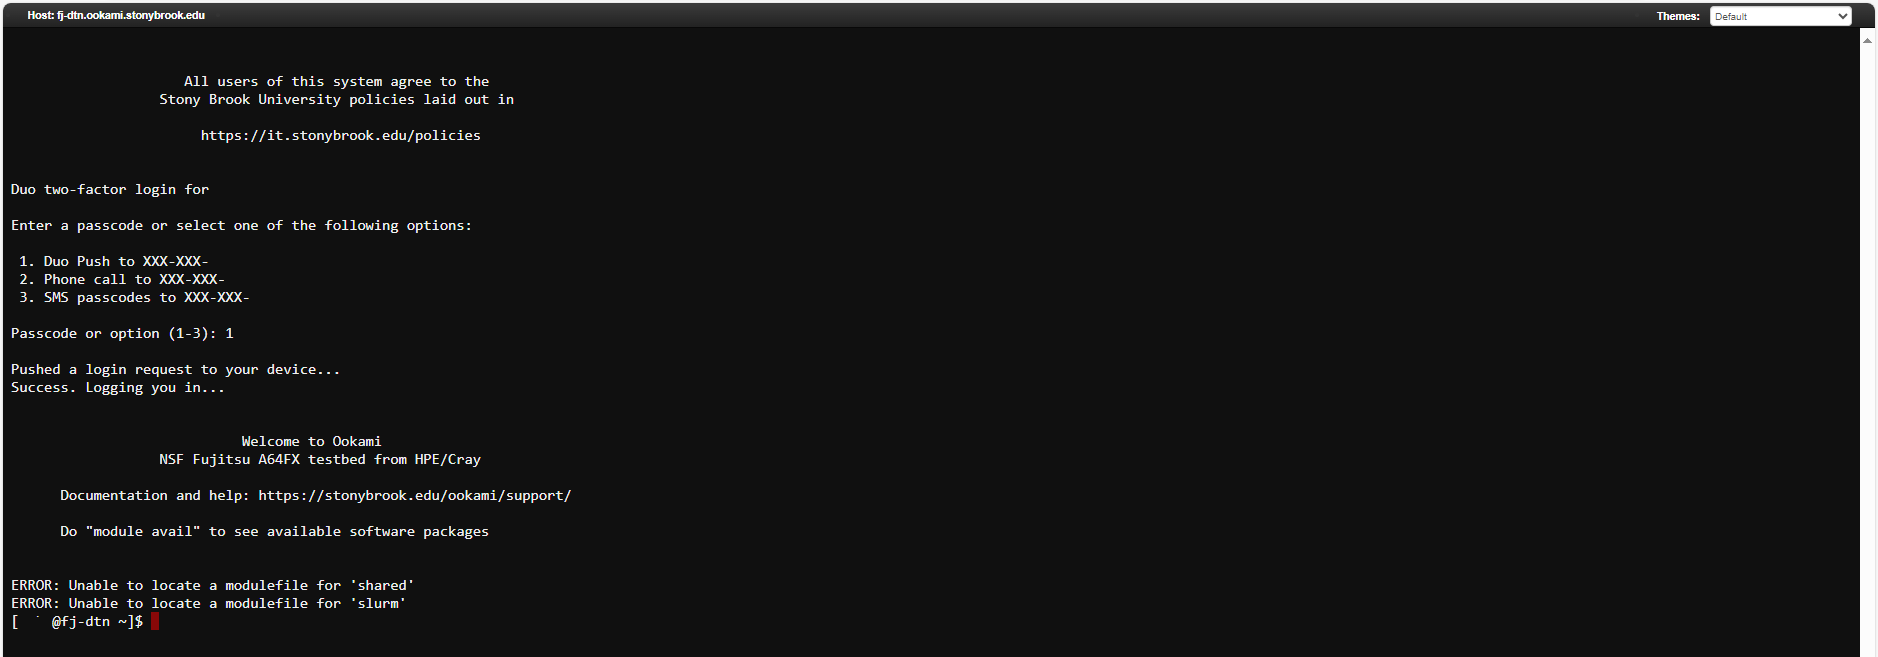
Once you are done, simply close the tab.
More details and official documentation on Open OnDemand can be found here, the Open OnDemand project site.
Interactive Sessions
Interactive Sessions
Requesting an Interactive Session in Slurm
The Slurm scheduler allows for running an interactive shell on compute nodes. First, load the slurm module.
module load slurm
To enter an interactive session, use the srun command with the --pty directive. At a minimum, provide the following options to srun to enable the interactive shell:
srun -p <queue> --pty bash
You can pass the same additional options to srun as you would in your Slurm job script files. Some useful options are:
- -N <# of nodes>
- -t hh:mm:ss or w-hh:mm:ss
- -n <tasks per node>
For an interactive job using 1 node and 24 tasks per node with a 4 hour run time on the short queue, this would look like:
srun -N 1 -n 24 -t 04:00:00 -p short --pty bash
Running an interactive job
Upon initializing the interactive shell, you will be taken away from the login node.
All of your environment variables from the login node will be copied to your interactive shell (just as when you submit a job). This means all of your modules will still be loaded and you will remain in the same working directory as before. You can immediately run your program for testing:
All contents sent to stdout will be printed directly to the terminal unless otherwise directed. For more infornation on handling output see the associated FAQ page.
Compilers and vectorization
Getting performance on Ookami
Compiling-for-performance checklist on Ookami
For getting good performance on Fujitsu A64FX there are a few things to consider during compilation. Please have a look at the getting-started guide and also see the checklist below for guidance:
- Compiler(s)
- Optimization flags
- Vectorization flags
- Introspection flags (ask compiler to tell you what it is optimizing/vectorizing)
- Is the code parallelized?
- How?
- MPI + version + underlying compilers
- OpenMP
- Threads
- Other
- How?
- Layout of code in NUMA regions, threads, and across compute nodes
- MPI ranks
- Threads per rank
- Placement of ranks
We put together a matrix of useful options for our various compilers here , the vectorization flags entry on this page
If you have any questions please use the slack channel, the office hours, or submit a ticket
Useful flags for vectorization
Vectorization Flags
To enable vectorization it is important to set specific flags for the compiler. There are also flags for causing the compiler to generate messages on what it did vectorize. Here the most important flags are given.
Cray | Arm | GNU | Nvidia | ||
|---|---|---|---|---|---|
| Flags | |||||
| Pre-23 CPE | CPE 23 and later: (not applicable for Fortran) | all versions | >= gcc 11 | all versions | |
| Optimization | -O3 | -O3 | -O3 or -Ofast | -O3 or -Ofast | -fast (check documentation) |
| Vectorization | -h vector3 | Automatic (if -O3 or -O2 flag is set) | -mcpu=a64fx -armpl | -mcpu=a64fx | -tp=native (on a64fx node) |
| Vectorization report | -h msgs | -Rpass=loop-vectorize | -Rpass=loop-vectorize | -fopt-info-vec | -Minfo=vect |
| Report on missed optimization | -h negmsgs | -Rpass-analysis=loop-vectorize | -Rpass-analysis=loop-vectorize | -fopt-info-vec-missed | -Mneginfo |
| OpenMP | -h omp | -fopenmp | -fopenmp | -fopenmp | -mp -acc for OpenACC |
| Debugging | -G 2 | -ggdb | -ggdb | -ggdb | -g or -gopt (see documentation) |
| Large memory | -h pic | -mcmodel=large | -mcmodel=large | -mcmodel=large | -mcmodel=large |
| Module | CPE/version | CPE/23.02(or newer) | arm-modules/version | gcc/version | nvidia/nvhpc-nompi/version |
| Compiler names | |||||
| C | cc | armclang | gcc | nvc | |
| C++ | CC | armclang++ | g++ | nvc++ | |
| Fortran | ftn | armflang | gfortran | nvfortran | |
Showing vectorization for different compilers
Note that this article contains results of the Fujitsu compiler, which is not available anymore on Ookami
Vectorization for different compilers
Compilers can do vectorization when setting the right flags. Here we are showing two examples of code compiled with the Cray, Arm and gnu compiler.
Simple math functions
The investigated functions are: Simple (Y = 2 X + 3 X2), Reciprocal, Square root, Exponential, Sin, Power function. Those are compiled using three different compilers, Cray, Arm and GNU (source code here, the Ookami example codes repository on GitHub). The compiler specific vectorization flags are turned on.
void Xsimple(size_t n, const double* __restrict__ x, double* __restrict__ y) {
  for (size_t i=0; i<n; i++) y[i] = 2.0*x[i] + 3.0*x[i]*x[i];
}

void Xrecip(size_t n, const double* __restrict__ x, double* __restrict__ y) {
  for (size_t i=0; i<n; i++) y[i] = 1.0/x[i];
}

void Xsqrt(size_t n, const double* __restrict__ x, double* __restrict__ y) {
  for (size_t i=0; i<n; i++) y[i] = std::sqrt(x[i]);
}

void Xexp(size_t n, const double* __restrict__ x, double* __restrict__ y) {
  for (size_t i=0; i<n; i++) y[i] = std::exp(x[i]);
}

void Xsin(size_t n, const double* __restrict__ x, double* __restrict__ y) {
  for (size_t i=0; i<n; i++) y[i] = std::sin(x[i]);
}

void Xpow(size_t n, const double* __restrict__ x, double* __restrict__ y) {
  for (size_t i=0; i<n; i++) y[i] = std::pow(x[i],0.55);
}
Below you can find the compiler versions and flags (for vectorization and vectorization
reports) used for this example
Cray
module load CPE/22.03
Cray C++ : Version 10.0.3
with the compiler flags
-O3 -h aggress,flex_mp=tolerant,msgs,negmsgs,vector3,omp
Flag description:
O3
Optimization level 3
aggress
Provides greater opportunity to optimize loops that would otherwise by inhibited from
optimization due to an internal compiler size limitation.
flex_mp=tolerant
Controls the aggressiveness of optimizations which may affect floating point and complex
repeatability when application requirements require identical results whenvarying
the number of ranks or threads. Tolerant uses most aggressive optimization and yields
highest performance, but results may not be sufficiently repeatable for some applications
msgs
Causes the compiler to write optimization messages to stderr.
negmsgs
Causes the compiler to generate messages to stderr that indicate why optimizations
such as vectorization or inlining did not occur in a given instance.
vector3
Specifies the level of automatic vectorizing to be performed. Vectorization results
in dramatic performance improvements with a small increase in object code size. Vectorization
directives are unaffected by this option. 3 specifies aggressive vectorization.
omp
OMP supportArm
module load arm-modules/22.0
Arm C/C++/Fortran Compiler version 22.0.1
with the compiler flags
-Ofast -ffp-contract=fast -Wall -Rpass=loop-vectorize -march=armv8.2-a+sve -mcpu=a64fx -armpl -fopenmp
Flag description:
Ofast
Enables all the optimizations from level 3 including those performed with the -ffp-mode=fast
armclang option. This level also performs other aggressive optimizations that might
violate strict compliance with language standards. -Ofast implies -ffast-math.
ffp-contract=fast
If you set -ffp-contract=fast fused floating-point contractions are always used and
the compiler ignores the 'STDC FP_CONTRACT' pragma setting.
Wall
Enable all warnings.
Rpass=loop-vectorize
Enable vectorization report
march=armv8.2-a+sve
Specifies architecture and extensions.
mcpu=a64fx
Select CPU architecture.
armpl
Use the 'Generic' SVE library from Arm Performance Libraries.
fopenmp
Enable OpenMPGNU
module load gcc/12.1.0
gcc (GCC) 12.1.0
with the compiler flags
-Ofast -Wall -mtune=a64fx -mcpu=a64fx -march=armv8.2-a+sve -fopt-info-vec -fopenmp
Flag description:
Ofast, Wall, mcpu=a64fx, march=armv8.2-a+sve
see descriptions above
mtune=a64fx
Tune to cpu-type
fopt-info-vec
Output vectorization report.
Fujitsu
module load fujitsu/compiler/4.7
FCC (FCC) 4.7.0 20211110
with the compiler flags
-Kfast -KSVE -Koptmsg=2
Flag description:
Kfast
Optimization
KSVE
Vectorization
Koptmsg=2
Output vectorization report.
When compiling the compiler output suggests that Fujitsu, Cray and Arm vectorize all functions, whereas GNU can't vectorize exp, sin and pow.
| Fujitsu | Cray | Arm | GNU | |
|---|---|---|---|---|
| Simple (Y = 2 X + 3 X2) | Yes | Yes | Yes | Yes |
| Reciprocal | Yes | Yes | Yes | Yes |
| Square root | Yes | Yes | Yes | Yes |
| Exponential | Yes | Yes | Yes | |
| Sin | Yes | Yes | Yes | |
| Power | Yes | Yes | Yes |
However, looking at the runtimes of the functions gives a more complex picture (see Figure 1 & 2). The Fujitsu and cray compilers vectorizes everything as claimed. The arm compiler claims to vectorize all functions. It is doing this but some functions are not vectorized in the most efficient way. The code assembly shows that it uses the DIV and SQRT functions rather than the more efficient Netwon algorithm. And the gnu compiler just vectorizes the simple function. The recip and sqrt are not vectorized as expected from the compiler output.
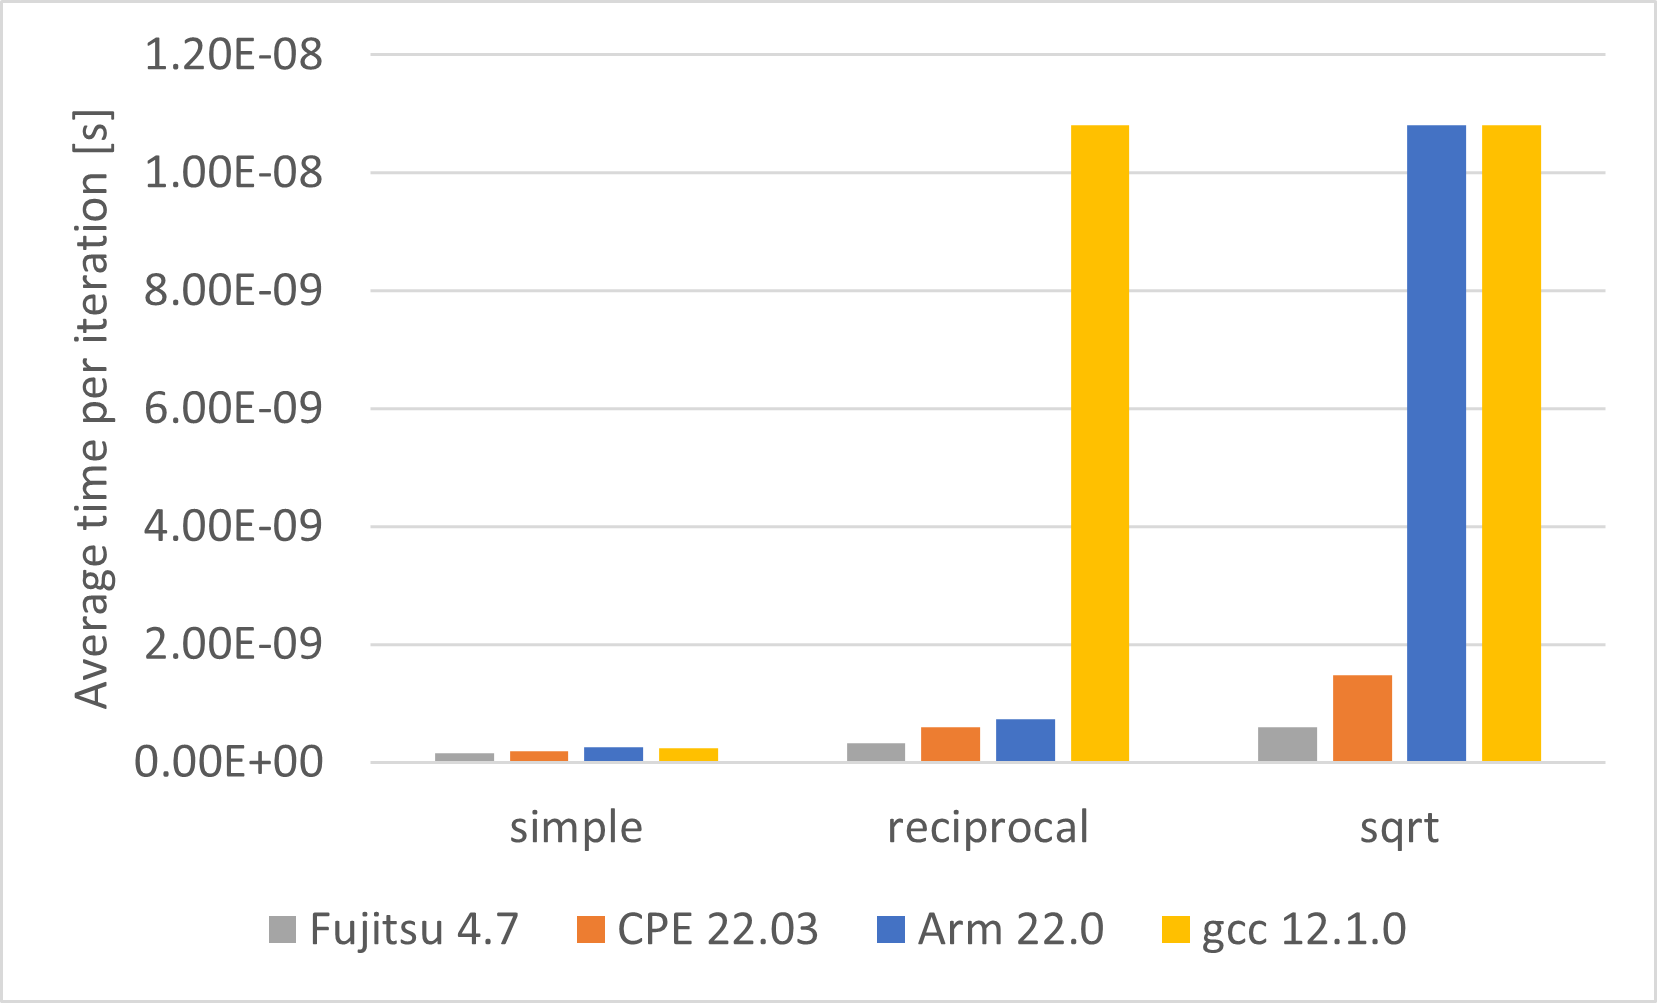
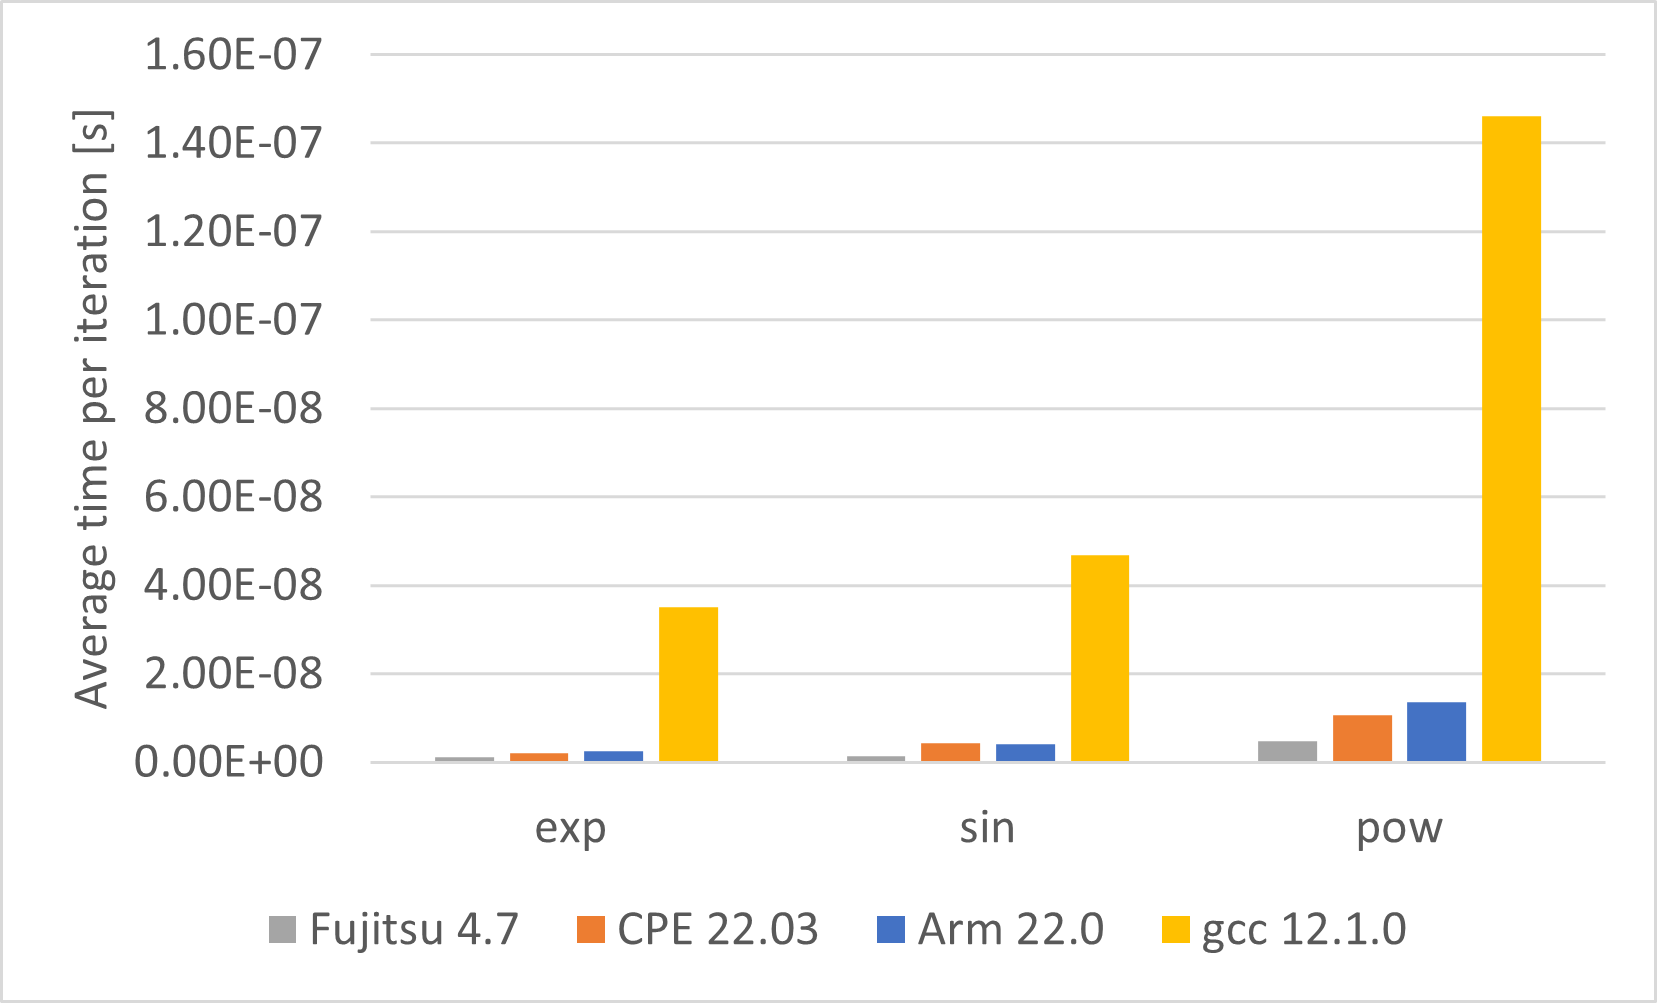
Figure 1 & 2: Runtimes of the simple math functions for different compilers.
The Fujitsu compiler gives the best results.
Conditional Compilation by Architecture
Conditional Compilation by Architecture
This entry covers determining your current system's architecture, finding the predefined macro for the target architecture, and using preprocessor directives to achieve conditional compilation.
Determining current system architecture
By using lscpu and looking at the Architecture field, we can determine the current system's architecture.
Architecture:        aarch64
Byte Order:          Little Endian
CPU(s):              256
On-line CPU(s) list: 0-255
Thread(s) per core:  4
Core(s) per socket:  32
Socket(s):           2
NUMA node(s):        2
Vendor ID:           Cavium
Model:               1
Model name:          ThunderX2 99xx
Stepping:            0x1
BogoMIPS:            400.00
L1d cache:           32K
L1i cache:           32K
L2 cache:            256K
L3 cache:            32768K
NUMA node0 CPU(s):   0-127
NUMA node1 CPU(s):   128-255
Flags:               fp asimd evtstrm aes pmull sha1 sha2 crc32 atomics cpuid asimdrdm
Finding the predefined C macro for the target architecture
Using the command shown below, you can find a list of potentially useful predefined macros for your C or C++ code.
gcc -dM -E - < /dev/null
We can use the architecture we obtained from lscpu to filter this list of macros to look for our architecture's macro. Different machines will define a different macro depending on the architecture.
$ gcc -dM -E - < /dev/null | grep aarch64
#define __aarch64__ 1
Conditional Compilation
By using preprocessor directives such as #ifdef and #else in combination with the macro we obtained in the last section, we can define code to be compiled a certain way if it's an aarch64 and a different way otherwise.
#ifdef __aarch64__

#include <stdint.h>

long long readTSC(void)
{
    uint64_t ticks;

    asm volatile("isb" : : : "memory");
    asm volatile("mrs %0, cntvct_el0" : "=r" (ticks));
    return (long long) ticks;
}

#else

long long readTSC(void)
{
    union { long long complete; unsigned int part[2]; } ticks;
  __asm__ ("rdtsc; mov %%eax,%0;mov %%edx,%1"
            : "=mr" (ticks.part[0]),
              "=mr" (ticks.part[1])
            : /* no inputs */
            : "eax", "edx");
  return ticks.complete;
}

#endif
How can I use the ARM compilers?
Using the ARM compilers on Ookami
Ookami users can take advantage of the ARM Allinea Studio software suite that includes a set of compilers, high performance math libraries, and performance profiling tools.
To use the ARM compilers, you must first be on a node with aarch64 CPU architecture.
Therefore, users should first either:
A) start an interactive Slurm job
or
B) ssh to one of the accessible aarch64 nodes
or
C) Alternatively, if no interactive session is desired, users may simply write and submit a Slurm job submission script to compile the code.
Once on an appropriate node, load the following module to access the latest Arm compilers:
module load arm-modules/version
This will add the armclang, armclang++, and armflang executables as well as the arm performance libraries to your $PATH.
Here, we will use an example matrix multiplication code to demonstrate the use of the armclang++ compiler. Because this code compiles without issue and does not require any interactive troubleshooting, we can write a Slurm script to compile and run the code:
#!/usr/bin/env bash

#SBATCH --job-name=arm_example
#SBATCH --output=arm_example.log
#SBATCH --ntasks-per-node=48
#SBATCH --nodes=1
#SBATCH --time=05:00
#SBATCH -p short

# unload any modules currently loaded
module purge

# make the ARM modules available
module load arm-modules/version

# copy the sample C++ code to the working directory
cp /lustre/projects/global/samples/ARM-sample/mm.cpp $SLURM_SUBMIT_DIR

# compile the code using the ARM C++ compiler
armclang++ mm.cpp -o mm

# run the code on an 1000 x 1000 x 1000 matrix
./mm 1000 1000 1000
Let's call this script "arm-example.slurm" and submit it with sbatch:
sbatch arm-example.slurm
Once the job has run, you should see something similar to the following in the job's log file ("arm_example.log"), indicating that the matrix multiplication code has compiled and run sucessfully:
Set up of matrices took: 0.182 seconds
Performing multiply
Naive multiply took: 20.884 seconds
Example code for testing the ARM compilers can be copied from the following directory:
/lustre/projects/global/samples/ARM-sample
How can I use the Cray compilers?
Using the Cray compilers on Ookami
Ookami users can take advantage of the Cray Programming Environment that includes a set of compilers, high performance math libraries, and performance profiling tools.
To use the Cray compilers, you must first be on a node with aarch64 CPU architecture.
Therefore, users should first either:
A) start an interactive Slurm job
or
B) ssh to one of the accessible aarch64 nodes
or
C) Alternatively, if no interactive session is desired, users may simply write and submit a Slurm job submission script to compile the code.
Once on an appropriate node, load the following module to access the Cray compilers:
module load CPE
This is a meta-module that loads several different modules needed for accessing the Cray Programming Environment. Loading it will add the c ("cc"), c++ ("CC"), and fortran ("ftn") compiler executables to your PATH.
Here, we will use an example matrix multiplication code to demonstrate the use of the Cray c++ compiler. Because this code compiles without issue and does not require any interactive troubleshooting, we can write a Slurm script to compile and run the code:
#!/usr/bin/env bash

#SBATCH --job-name=cray_example
#SBATCH --output=cray_example.log
#SBATCH --ntasks-per-node=48
#SBATCH --nodes=1
#SBATCH --time=05:00
#SBATCH -p short

# unload any modules currently loaded
module purge

# load the CPE module to setup the cray programming environment
module load CPE

# copy the sample C++ code to the working directory
cp /lustre/projects/global/samples/Cray-sample/mm.cpp $SLURM_SUBMIT_DIR

# compile the code using the Cray C++ compiler
CC mm.cpp -o mm

# run the code on a 1000 x 1000 x 1000 matrix
./mm 1000 1000 1000
Let's call this script "cray-example.slurm" and submit it with sbatch:
sbatch cray-example.slurm
Once the job has run, you should see something similar to the following in the job's log file ("cray_example.log"), indicating that the matrix multiplication code has compiled and run sucessfully:
Set up of matrices took: 0.151 seconds
Performing multiply
Naive multiply took: 5.939 seconds
Example code for testing the Cray compilers can be copied from the following directory:
/lustre/projects/global/samples/Cray-sample
In case you want to use Cray and the mvapich module, load them in seperate commands and in the right order
module load CPEThe mvapich module picks up environment variables set by CPE, so if you run everthing in one module load command, this doesn't work.If you prefer to use a version of mvapich without SVE support, you should load the following modules instead:
module load cray-mvapich2_nogpu_sve/2.3.6
module load CPE-nosve
module load cray-mvapich2_nogpu/2.3.6
To see the Cray manpages use
man crayftn
man craycc
man crayCC
How can I use the GCC compilers?
Using the GCC compilers on Ookami
Ookami users can take advantage of multiple versions of the GNU Compiler Collection (GCC) on Ookami.
To use the gcc compilers, you must first be on a node with aarch64 CPU architecture.
Therefore, users should first either:
A) start an interactive Slurm job
or
B) ssh to one of the accessible aarch64 nodes
or
C) Alternatively, if no interactive session is desired, users may simply write and submit a Slurm job submission script to compile the code.
Once on an appropriate node, multiple gcc versions are available.
gcc version 8.3.1 is the system default version of gcc and is available without loading any modules. If desired, a newer version may be accessed via a module:
module load gcc/11.2.0
This will add the gcc, g++, and gfortran compiler executables to your PATH.
Here, we will use an example matrix multiplication code to demonstrate the use of the g++ compiler. Because this code compiles without issue and does not require any interactive troubleshooting, we can write a Slurm script to compile and run the code:
#!/usr/bin/env bash
#SBATCH --job-name=gcc_example
#SBATCH --output=gcc_example.log
#SBATCH --ntasks-per-node=48
#SBATCH --nodes=1
#SBATCH --time=05:00
#SBATCH -p short
# unload any modules currently loaded
module purge
# load the gcc 11 module
module load gcc/11.2.0
# copy the sample C++ code to the working directory
cp /lustre/projects/global/samples/ARM-sample/mm.cpp $SLURM_SUBMIT_DIR
# compile the code using the g++ compiler
g++ mm.cpp -o mm
# run the code on an 1000 x 1000 x 1000 matrix
./mm 1000 1000 1000
Let's call this script "gcc-example.slurm" and submit it with sbatch:
sbatch gcc-example.slurm
Once the job has run, you should see something similar to the following in the job's log file ("gcc_example.log"), indicating that the matrix multiplication code has compiled and run sucessfully:
Set up of matrices took: 0.173 seconds
Performing multiply
Naive multiply took: 28.013 seconds
Example code for testing the GCC compilers can be found copied from:
/lustre/projects/global/samples/gcc-sample
How can I use the NVIDIA HPC SDK compilers?
Using the NVIDIA HPC SDK compilers on Ookami
Note: currently Ookami doe not offer GPUs
Ookami users can take advantage of the NVIDIA HPC Software Development Kit (SDK), which includes a set of compilers, performance tools, and math and communications libraries for developing GPU-accelerated applications.
Currently, Ookami users should run their GPU-related tasks on the fj-epyc node, which contains two Tesla V100 GPUs.
Therefore, to make use of NVIDIA HPC SDK users should first either:
A) start an interactive Slurm job and request the milan-64core partition
or
C) Alternatively, if no interactive session is desired, users may simply write and submit a Slurm job submission script to compile the code.
Once on the appropriate node, there are several different sets of modules that can be chosen, depending on the version of CUDA desired. For CUDA 11.0, load one of the following
# Full set of Nvidia compilers, libraries, CUDA 11.0, and MPI
nvidia/cuda11.0/nvhpc/21.5
# Nvidia libraries, CUDA, and MPI but without the complete compiler suite (BYO compilers)
nvidia/cuda11.0/nvhpc-byo-compiler/21.5
# Nvidia compilers, libraries abd CUDA but without MPI
nvidia/cuda11.0/nvhpc-nompi/21.5
A similar set of modules can also be chosen for CUDA 10.2 and 11.3 by replacing "11.0"
in the module name with the appropriate version number.
Let's load the standard module for CUDA 11.0:
module load nvidia/cuda11.0/nvhpc/21.5
This will add several compilers, including nvc, nvcc, nvfortran, and nvc++, along with compatible MPI compilers and runtime executables to the PATH.
Next, we will use ahydrodynamics mini-app that solves compressible Euler equations in 2D to demonstrate the use of the GPU-accelerated nvfortran compiler. Because this code compiles without issue and does not require any interactive troubleshooting, we can write a Slurm script to compile and run the code:
#!/usr/bin/env bash
#SBATCH --job-name=nvhpc_example
#SBATCH --output=nvhpc_example.log
#SBATCH --ntasks-per-node=64
#SBATCH --nodes=1
#SBATCH --time=05:00
#SBATCH -p milan-64core
# unload any modules currently loaded
module purge
# load the nvhpc module
module load nvidia/cuda11.0/nvhpc/21.5
# copy the sample directory with the CloverLeaf mini-app code to the working directory
cp -r /lustre/projects/global/samples/CloverLeaf_OpenACC $SLURM_SUBMIT_DIR
# change to the newly copied directory
cd CloverLeaf_OpenACC
# compile the code
make COMPILER=PGI MPI_COMPILER=mpif90
# set environment variable to get information about the GPU usage printed to the log
NV_ACC_NOTIFY=1
# run the code on a single GPU with one thread
OMP_NUM_THREADS=1 mpirun -np 1 ./clover_leaf
Let's call this script "nvhpc-example.slurm" and submit it with sbatch:
sbatch nvhpc-example.slurm
Once the job has run, you should see voluminous compilation and runtime information in the job's log file ("nvhpc_example.log"). The end of the log file should contain something similar to the following, indicating that the test was successful:
Test problem 2 is within 0.1170175E-10% of the expected solution
This test is considered PASSED
Wall clock 0.3163411617279053
First step overhead 1.9407272338867188E-004
How can I use the AMD compilers?
Using the AMD compilers on Ookami
Ookami users can take advantage of the AMD Optimizing C/C++ Compiler (AOCC) software suite that includes a set of compilers and debuggers tuned and optimzed for the AMD EPYC architecture.
While the AMD compilers should work on any Ookami x86_64 node, we recommend specifically
using it on the fj-epyc node, as it contains the architecture for which AOCC is optimized.
Therefore, users should first either:
A) start an interactive Slurm job and request the milan-64core partition
or
C) Alternatively, if no interactive session is desired, users may simply write and submit a Slurm job submission script to compile the code.
Once on an appropriate node, load the following module:
module load aocc/3.0.0
This will add the clang, clang++, and flang executables (among others) to your $PATH.
Here, we will use an example matrix multiplication code to demonstrate the use of the clang++ compiler. Because this code compiles without issue and does not require any interactive troubleshooting, we can write a Slurm script to compile and run the code:
#!/usr/bin/env bash
#SBATCH --job-name=amd_example
#SBATCH --output=amd_example.log
#SBATCH --ntasks-per-node=64
#SBATCH --nodes=1
#SBATCH --time=05:00
#SBATCH -p milan-64core
# unload any modules currently loaded
module purge
# load the AOCC module
module load aocc/3.0.0
# copy the sample C++ code to the working directory
cp /lustre/projects/global/samples/ARM-sample/mm.cpp $SLURM_SUBMIT_DIR
# compile the code using the AMD clang++ compiler
clang++ mm.cpp -o mm
# run the code on an 1000 x 1000 x 1000 matrix
./mm 1000 1000 1000
Let's call this script "amd-example.slurm" and submit it with sbatch:
sbatch amd-example.slurm
Once the job has run, you should see something similar to the following in the job's log file ("amd_example.log"), indicating that the matrix multiplication code has compiled and run sucessfully:
Set up of matrices took: 0.020 seconds
Performing multiply
Naive multiply took: 3.312 seconds
What math libraries are available on Ookami?
Math libraries on Ookami
There are multiple math libraries available on Ookami, listed below.
LAPACK: Linear algebra package
BLAS: Basic linear algebra subprograms
ScaLAPACK: Scalable linear algebra package
FFTW: Fastest Fourier Transform in the West
The specific implementation of these libraries on Ookami will depend on which compiler you are using.
Cray LibSci
Cray users can take advantage of the LibSci library to access versions of BLAS, LAPACK, and SCALAPACK that have been optimized for Cray
systems.
To access these libraries on Ookami, please load the following module:
module load CPE
This will load several Cray modules, including the cray-libsci/20.10.1.2 module.
To additionally make a Cray version of FFTW available, please load the following module
(after loading CPE):
module load cray-fftw/3.3.8.8
Arm Performance Libraries
The Arm Performance Libraries provide optimized versions of BLAS, LAPACK and FFTW. To access these libraries, please do the following:
module load arm-modules/22.1
module load armpl/22.1.0
Because Arm does not provide an MPI implementation, we have built our own version of SCALAPACK using the Arm compilers and performance libraries along with OpenMPI. To access it, please load the following module:
module load scalapack/arm22/2.2.0
OpenBLAS
OpenBLAS is an optimized and SVE-enabled version of the BLAS library available on Ookami. To access a recent version of OpenBLAS compiled with the latest GCC, please do:
module load openblas/gcc13/0.3.21What are Modules?
Understanding Modules
To manage the complexity of the software environment, Ookami uses environment modules.
Each module encapsulates particular software packages that are made available to users.
This allows for separate toolchains and compiler environments to be installed on the
cluster at the same time without causing errors. Each module file contains the information
needed to configure the shell for an application, including all of the dependencies.
The main command to interact with modules is the module command. To get an overview, execute the command:
module --help
The commands used most often are:
module list (returns a list of all the currently loaded modules)
module avail (returns a list of the available modules)
module [load | add] (adds module to the current environment)
module [unload | rm] (removes a module from the current environment)
module initadd (adds modulefile(s) so they start up automatically when logging in)
IMPORTANT: Some of the modules are listed as local while the others are listed as
shared. Local modules are local to the login node. Shared modules are used throughout
the entire cluster.
Because Ookami contains nodes with different types of CPU architectures, some modules
will be available on certain nodes and unavailable on the others. For example, the
Intel compiler module (intel/compiler/64/2020/20.0.2) can only be used on nodes with
x86_64 architecture.
On the login nodes the module avail command will show all modules for the different architectures in Ookami. Note that not all of these run on the login nodes which are ThunderX2 (aarch64). The path indicates the architecture on which the modules can be used (see figure)
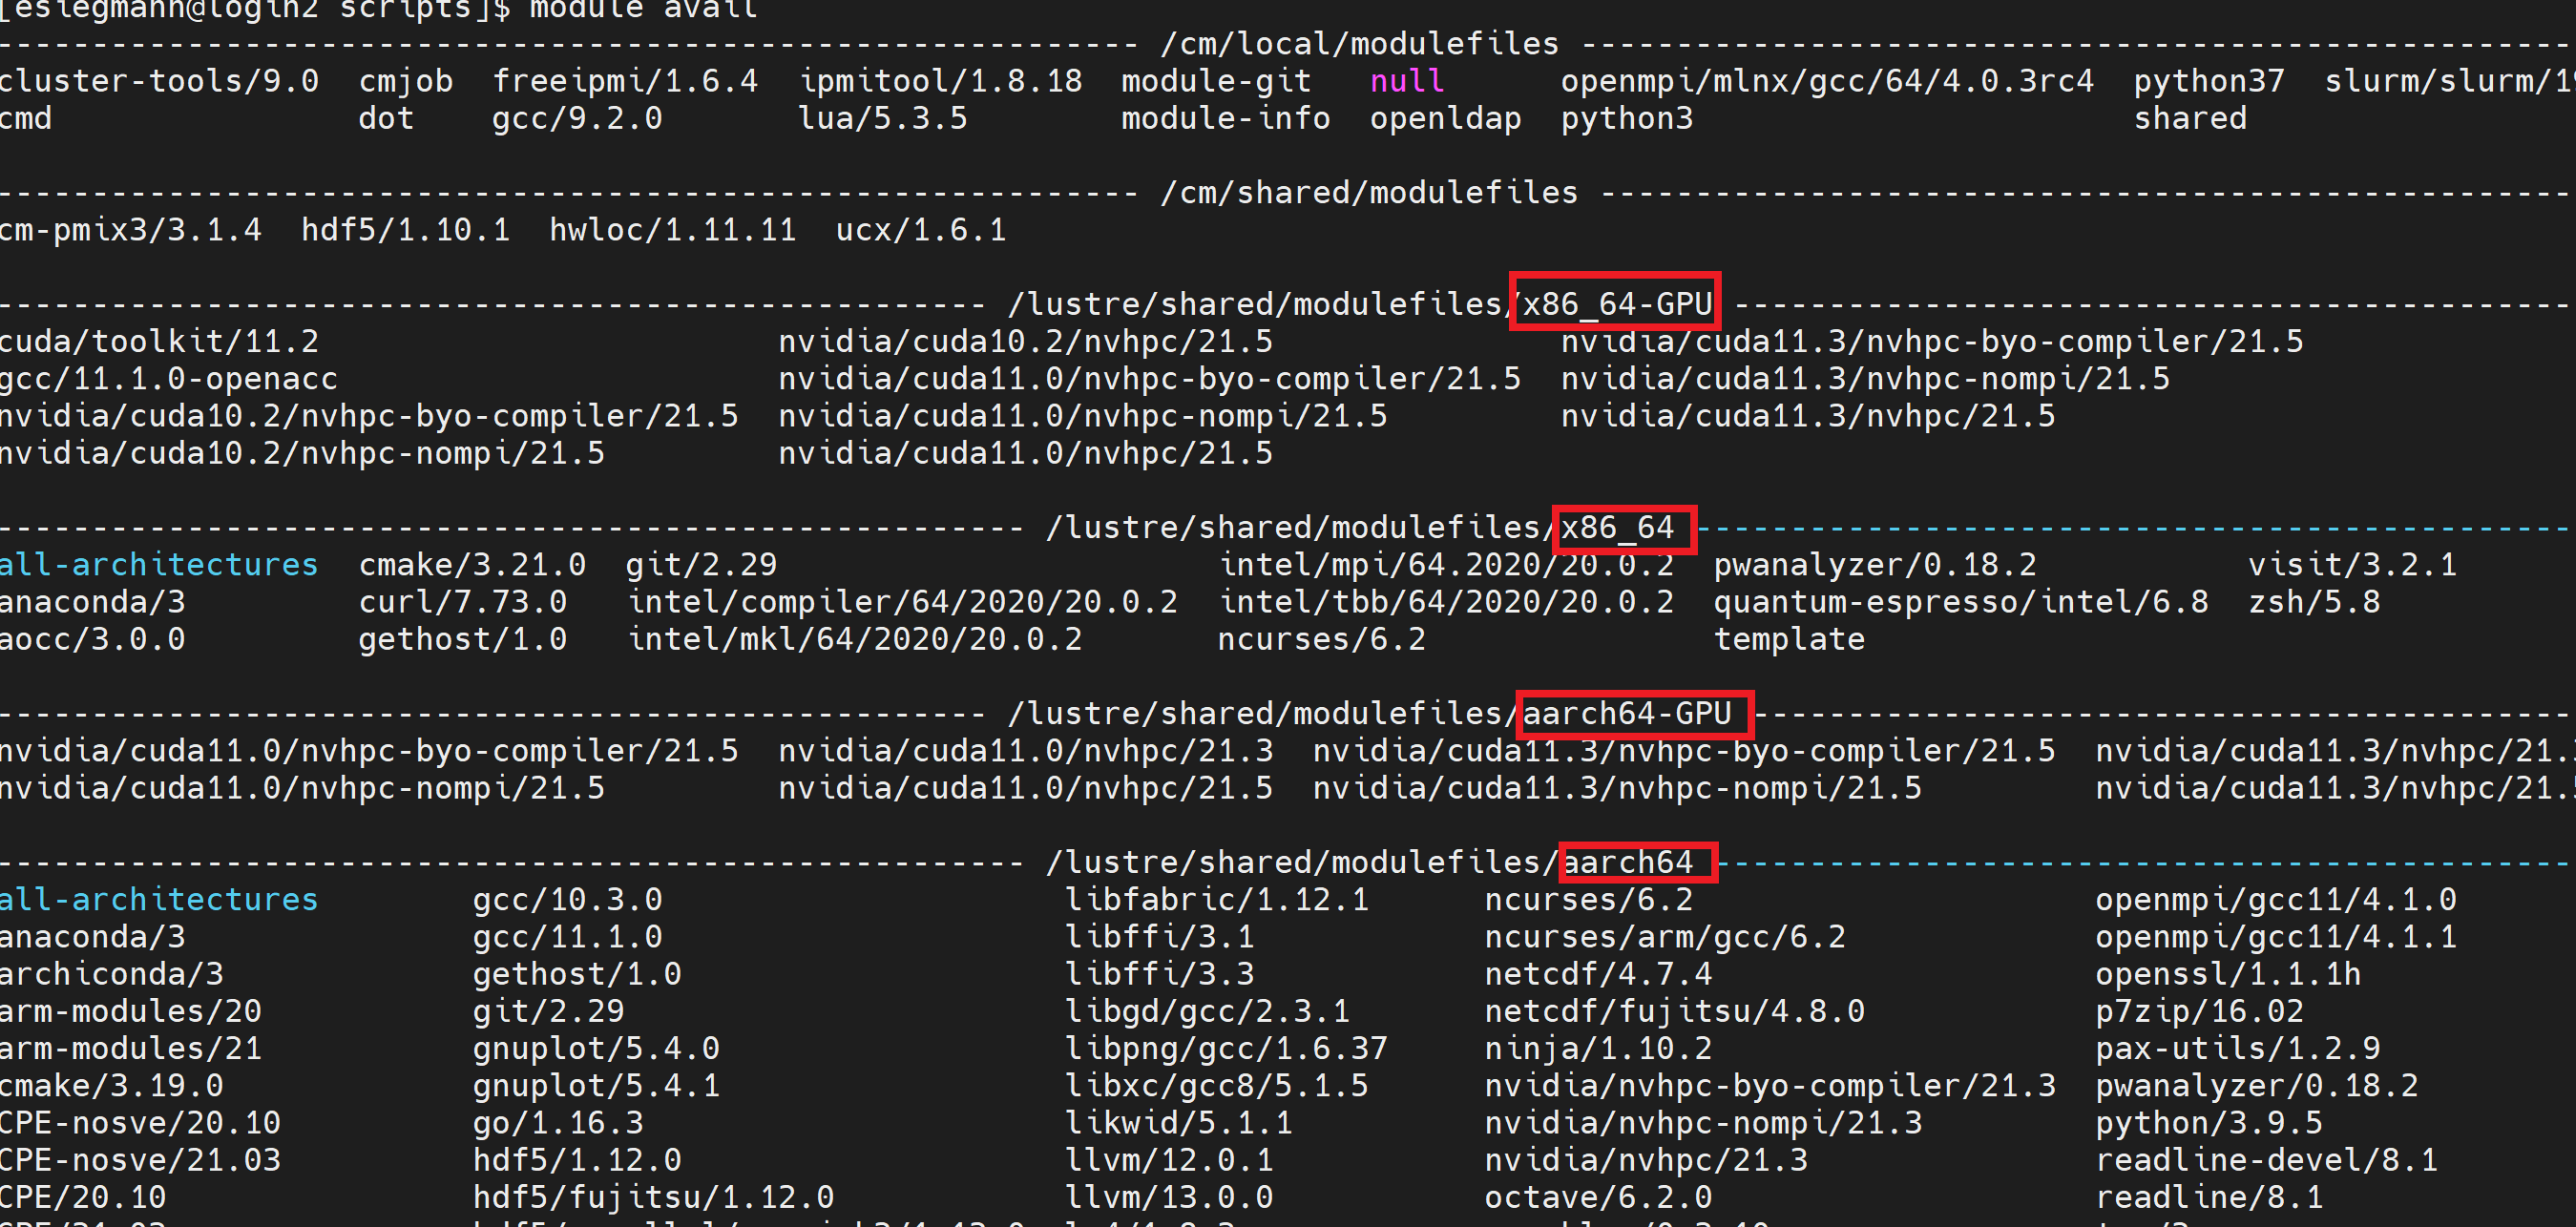
On all other nodes module avail will just show the modules for the architecture of the current node.
After logging on to Ookami, users setup their environment by loading modules as needed into the current shell. While it is possible to code this information directly into a .bashrc or .bash_profile, we tend to discourage users from doing this in order to fully utilize a modular environment.
What Software is Installed on Ookami
Software installed on Ookami
The toolchains of gnu, arm and cray are currently installed on Ookami.
Arm contains the debugger ddt, the profiler map, and the performance reports for advanced reporting capabilities. The Cray toolchain includes the debugging tools gdb4hpc (general debugger), valgrind4hpc (for detecting memory leaks and errors in parallel applications) and atp (first-line tool to diagnosis crashing applications). The GNU toolchain provides the gdb debugging tool.
Other than that, various libraries (e.g. lapack, openblas, fftw) and various MPIs are installed on the system.
Installed science codes include (note that this list is continuously growing and not immediatley updated here. Also if you require a specific software, let us know and we will install it):
- Gromacs
- Lammps
- Namd
- OpenFOAM
- QuantumEspresso
- Siesta
- VASP
Running jobs
Example Slurm Job Script
Example Slurm Job Script
This is an example slurm job script for the Ookami short queue:
#!/usr/bin/env bash
#SBATCH --job-name=examplejob
#SBATCH --output=examplejob.log
#SBATCH --ntasks-per-node=48
#SBATCH -N 2
#SBATCH --time=00:05:00
#SBATCH -p short
module load slurm
module load CPE
module load cray-mvapich2_nogpu_sve/2.3.6
mpicc /lustre/projects/global/samples/HelloWorld/mpi_hello.c -o mpi_hello
srun ./mpi_hello
This job will utilize 2 nodes, with 48 CPUs per node for 5 minutes in the short partition to compile and run an mpi_hello script.
If we named this script "test.slurm", we could submit the job using the following command:
sbatch test.slurm
Breakdown:
The directive
#SBATCH -p short
indicates to the batch scheduler that you want to use the short queue.
The directives
#SBATCH --ntasks-per-node=48
#SBATCH --nodes=2
#SBATCH --time=05:00
indicate that we are requesting 2 nodes, and we will run 48 tasks per node for 5 minutes.
All of these directives are passed straight to the sbatch command, so for a full list of options just take a look at the sbatch manual page by issuing the command:
man sbatch
For more information on SLURM, please also see the official documentation.
How to submit, delete and check the status of Slurm jobs
How to submit, delete, and check the status of Slurm job
To submit your slurm job to the scheduler, first load the slurm modules:
module load slurm
Then to submit the job, you can execute the command:
sbatch <jobfile>
Note that your job script must be saved to a file - copying and pasting the script into the shell will not work!
For a full list of options available to the squeue command issue:
man sbatch
After you've submitted a job, you chan check the status of the job using thesqueue command. Issuing this command alone will return the status of every job currently managed by the scheduler. As a result we recommend narrowing the results by user name or job number:
squeue --job <your_job_number>
or
squeue -u <your_user_name>
Or, for a full list of options available to the squeue command issue:
man squeue
If desired, you can issue the following command to delete a job:
scancel <job_id>
If you are unsure of what your job ID is (it was displayed when you ran sbatch), you can use squeue to get the job ID's of all of your jobs in the queue:
squeue -u <your_username>
You can learn about more options for the scancel command by reading through the manual page with the command:
man scancel
What queues are available on Ookami?
Ookami Queues / Partitions
There are several queues available on Ookami. The queues are managed by the Slurm scheduling software. Six of the eight Ookami queues use the same 48 core A64FX nodes so your choice among these queues depends on the length of time needed to run your job. The milan-64core provides acess to a single AMD Rome node (64 cores) with 512GB memory and the skylake-36core queue provides access to a single Intel Skylake node (36 cores) with 192 GB memory.
| Queue | Time Limit | Min Nodes | Max Nodes | CPU Architecture |
|---|---|---|---|---|
| short | 4 hours | 1 | 32 | A64FX |
| medium | 12 hours | 8 | 40 | A64FX |
| large | 8 hours | 24 | 80 | A64FX |
| long | 2 days | 1 | 8 | A64FX |
| extended | 7 days | 1 | 2 | A64FX |
| all-nodes | 4 hours | 81 | 174 | A64FX |
| milan-64core | 1 day | 1 | 1 | AMD Milan |
| skylake-36core | 1 day | 1 | 1 | Intel Skylake |
You can also check the queues using
sinfo -s
Note that slurm has to be loaded.
To enable a fair use of the cluster there are two restrictions in place:
- The maximum number of nodes a user can use at the same time is 120 (the all-nodes queue is excluded from this restriction to allow for full system runs)
- The maximum number of nodes a user can use at the same time in the extended queue is 28.
How to handle job output
Handling job output
Bash Script Redirection
One simple method for handling the output of your job is redirecting the program output directly in your batch script (the .slurm file you use to submit your job). This can be done with the > symbol.
ping stonybrook.edu > output.txt
This will write output from the ping command to a file called output.txt in the current working directory. Using this method, the output is written in real time. This means that if you submitted a job script with the command above and waited for it to start running, you could see the output being appended to output.txt from the login node in real time using a command liketail:
tail -f output.txt
Types of output
There are actually two types of output a program will produce: standard output and standard error. Normally, all of the output from the ping command will be sent to standard output. But if the network is down, the domain name cannot be found, the server doesn't respond, etc. these errors will be sent to standard error. The > symbol will by default overwrite any existing data in output.txt with the standard output of the command to the left of the symbol. We can place a 1 or 2 in front of the > symbol to explicitly redirect standard output or standard error, respectively. We can also use two greater than symbols (>>) to append the output to a file rather than overwrite. For example, this following command will write standard output to a file called out.txt, clearing out any previously existing data in that file. Standard error will be appended to the end a file called err.txt, and previous data in the file will not be overwritten.
ping notadomain.stonybrook.edu 1> out.txt 2>> err.txt
Or you could redirect both standard output and standard error using an ampersand:
ping stonybrook.edu &> alloutput.txt
Slurm Output Handling
By default, Slurm creates a file of the form slurm-<job ID>.txt for both standard output and standard error combined. You can specify specific files to store standard output and standard error with the -e and -o option respectively. You can also choose to append your output to the end of the specified file or clear out previously existing data using the --open-mode=append|truncate option. The default is truncate. Below is an example of appending your output to a standard output and standard error file using Slurm. Just like with bash script redirection, your output will be written in real time.
#SBATCH -e stderr.txt
#SBATCH -o stdout.txt
#SBATCH --open-mode=append
How do I control threads and CPUs on Ookami using OpenMP?
this FAQ section is currently under development
Thread Binding
Ookami users may wish to exercise control over how threads for their jobs are bound.
This article will discuss some OpenMP examples that offer various options for thread
binding.
Two particular environment variables may be used to control thread affinity for OpenMP
jobs:
OMP_PROC_BIND: controls whether and how threads are bound. Possible values include
| Value | Behavior |
|---|---|
| true | enable binding a thread (default) |
| false | disable thread binding |
| master | bind thread to same place as the parent thread |
| close | place threads as close as possible to the parent thread |
| spread | spread threads out as much as possible within the processor |
OMP_PLACES: describes the places where threads may be bound. Possible values include:
| Value | Behavior |
|---|---|
| threads | each place is a hardware thread |
| cores | each place is a single CPU |
| sockets | each place is a single socket (on Ookami this will be a NUMA node, not a socket) |
| < custom > | Manually specified place intervals with the syntax: <starting place location>:<number of places>:<size of stride> |
While testing thread-binding behavior, it may be useful to set one or more of the
following environment variables:
# turns on display of OMP's internal control variables
export OMP_DISPLAY_ENV=true

# display the affinity of each OMP thread
export OMP_DISPLAY_AFFINITY=true

# controls the format of the thread affinityexport
OMP_AFFINITY_FORMAT="Thread Affinity: %0.3L %.8n %.15{thread_affinity} %.12H"
The following "Hello World" examples will illustrate thread binding behavior under
a few different scenarios.
First, let's try binding each thread to a core:
#!/bin/sh

#SBATCH --partition=short
#SBATCH --job-name=omp_hello_cores
#SBATCH --output=omp_hello_cores.log
#SBATCH --nodes=1
#SBATCH --ntasks=4
#SBATCH --cpus-per-task=8 ### 48 threads (cores) per rank (node)
#SBATCH --time=1:00:00

#set up the environment--------------
module load slurm

# specify number of OMP threads
export OMP_NUM_THREADS=32

# enable thread binding and print out info on thread affinity
export OMP_DISPLAY_ENV=true
export OMP_DISPLAY_AFFINITY=true
export OMP_AFFINITY_FORMAT="Thread Affinity: %0.3L %.8n %.15{thread_affinity} %.12H"
export OMP_PROC_BIND=true

#Compiling OMP Hello World-----------
gcc -o hello-omp -fopenmp /lustre/projects/global/samples/HelloWorld/hello-omp.c

#Running------------------------------
#bind each thread to a core
export OMP_PLACES=cores

./hello-omp
In this case, we're running a single node job with 4 tasks, and 8 cores per task (32 threads total). The top of the log file shows information regarding our OMP settings:
  OPENMP DISPLAY ENVIRONMENT BEGIN
  _OPENMP = '201511'
  OMP_DYNAMIC = 'FALSE'
  OMP_NESTED = 'FALSE'
  OMP_NUM_THREADS = '32'
  OMP_SCHEDULE = 'DYNAMIC'
  OMP_PROC_BIND = 'TRUE'
  OMP_PLACES = '{0},{1},{2},{3},{4},{5},{6},{7},{8},{9},{10},{11},{12},{13},{14},{15},
{16},{17},{18},{19},{20},{21},{22},{23},{24},{25},{26},{27},{28},{29},{30},{31},{32},
{33},{34},{35},{36},{37},{38},{39},{40},{41},{42},{43},{44},{45},{46},{47}'
  OMP_STACKSIZE = '0'
  OMP_WAIT_POLICY = 'PASSIVE'
  OMP_THREAD_LIMIT = '4294967295'
  OMP_MAX_ACTIVE_LEVELS = '2147483647'
  OMP_CANCELLATION = 'FALSE'
  OMP_DEFAULT_DEVICE = '0'
  OMP_MAX_TASK_PRIORITY = '0'
  OMP_DISPLAY_AFFINITY = 'TRUE'
  OMP_AFFINITY_FORMAT = 'Thread Affinity: %0.3L %.8n %.15{thread_affinity} %.12H'
OPENMP DISPLAY ENVIRONMENT END
Note that each OMP place has been bound to a single core. Next we get information about each threads affinity:
Thread Affinity: 001        0               0        fj030
Thread Affinity: 001        1               1        fj030
Thread Affinity: 001        2               2        fj030
Thread Affinity: 001        3               3        fj030
Thread Affinity: 001        4               4        fj030
Thread Affinity: 001        5               5        fj030
...(truncated for legibility)...
In the first row, the '001' indicates the nesting level of the thread, the next column indicates the thread number (0-based index), the next
column indicates the thread affinity (indicating in this case that thread 0 is bound
to core 0), and the final column indicates the hostname of the compute node the thread
was found on.
Finally, we have the "Hello World" statements:
Hello world from thread 1 of 32 running on cpu  0 on fj030!
Hello world from thread 2 of 32 running on cpu  0 on fj030!
Hello world from thread 3 of 32 running on cpu  0 on fj030!
Hello world from thread 4 of 32 running on cpu  0 on fj030!
...(truncated for legibility)...
Since the code we ran indexes the threads starting at 1 and the CPUs starting at 0,
we can see that setting OMP_PLACES=cores has bound the first thread, to the first
CPU, the second thread to the second CPU...etc.
For some applications it may be beneficial to bind threads within individual NUMA nodes or Core Memory Groups (CMGs). To do this, we can change the value of OMP_PLACES to:
export OMP_PLACES=sockets
If we run the same script with this change, we see the following in the log:
OPENMP DISPLAY ENVIRONMENT BEGIN
  _OPENMP = '201511'
  OMP_DYNAMIC = 'FALSE'
  OMP_NESTED = 'FALSE'
  OMP_NUM_THREADS = '32'
  OMP_SCHEDULE = 'DYNAMIC'
  OMP_PROC_BIND = 'TRUE'
  OMP_PLACES = '{0:12},{12:12},{24:12},{36:12}'
  OMP_STACKSIZE = '0'
  OMP_WAIT_POLICY = 'PASSIVE'
  OMP_THREAD_LIMIT = '4294967295'
  OMP_MAX_ACTIVE_LEVELS = '2147483647'
  OMP_CANCELLATION = 'FALSE'
  OMP_DEFAULT_DEVICE = '0'
  OMP_MAX_TASK_PRIORITY = '0'
  OMP_DISPLAY_AFFINITY = 'TRUE'
  OMP_AFFINITY_FORMAT = 'Thread Affinity: %0.3L %.8n %.15{thread_affinity} %.12H'
OPENMP DISPLAY ENVIRONMENT END

Thread Affinity: 001        0            0-11        fj030
Thread Affinity: 001        1            0-11        fj030
Thread Affinity: 001        2            0-11        fj030
Thread Affinity: 001        3            0-11        fj030
Thread Affinity: 001        4            0-11        fj030
Thread Affinity: 001        5            0-11        fj030
Thread Affinity: 001        6            0-11        fj030
Thread Affinity: 001        7            0-11        fj030
Thread Affinity: 001        8           12-23        fj030
Thread Affinity: 001        9           12-23        fj030
Thread Affinity: 001       10           12-23        fj030
Thread Affinity: 001       11           12-23        fj030
Thread Affinity: 001       12           12-23        fj030
Thread Affinity: 001       13           12-23        fj030
Thread Affinity: 001       14           12-23        fj030
Thread Affinity: 001       15           12-23        fj030
Thread Affinity: 001       16           24-35        fj030
Thread Affinity: 001       17           24-35        fj030
Thread Affinity: 001       18           24-35        fj030
Thread Affinity: 001       19           24-35        fj030
Thread Affinity: 001       20           24-35        fj030
Thread Affinity: 001       21           24-35        fj030
Thread Affinity: 001       22           24-35        fj030
Thread Affinity: 001       23           24-35        fj030
Thread Affinity: 001       24           36-47        fj030
Thread Affinity: 001       25           36-47        fj030
Thread Affinity: 001       26           36-47        fj030
Thread Affinity: 001       27           36-47        fj030
Thread Affinity: 001       28           36-47        fj030
Thread Affinity: 001       29           36-47        fj030
Thread Affinity: 001       30           36-47        fj030
Thread Affinity: 001       31           36-47        fj030

Hello world from thread 1 of 32 running on cpu  0 on fj030!
Hello world from thread 2 of 32 running on cpu  3 on fj030!
Hello world from thread 3 of 32 running on cpu  4 on fj030!
Hello world from thread 4 of 32 running on cpu  5 on fj030!
Hello world from thread 5 of 32 running on cpu  6 on fj030!
Hello world from thread 6 of 32 running on cpu  7 on fj030!
Hello world from thread 7 of 32 running on cpu  8 on fj030!
Hello world from thread 8 of 32 running on cpu  9 on fj030!
Hello world from thread 9 of 32 running on cpu 12 on fj030!
Hello world from thread 10 of 32 running on cpu 13 on fj030!
Hello world from thread 11 of 32 running on cpu 14 on fj030!
Hello world from thread 12 of 32 running on cpu 12 on fj030!
Hello world from thread 13 of 32 running on cpu 15 on fj030!
Hello world from thread 14 of 32 running on cpu 14 on fj030!
Hello world from thread 15 of 32 running on cpu 16 on fj030!
Hello world from thread 16 of 32 running on cpu 17 on fj030!
Hello world from thread 17 of 32 running on cpu 24 on fj030!
Hello world from thread 18 of 32 running on cpu 25 on fj030!
Hello world from thread 19 of 32 running on cpu 24 on fj030!


...(truncated for legibility)...
Now we see that threads 0-7 are bound to CPUs in the first CMG (CPUs 0-11), threads 8-15 are bound to CPUs in the second CMG (CPUs 12-23), threads 16-23 are bound to CPUs in the third CMG (CPUs 24-35), and threads 24-31 are bound to CPUs in the fourth and final CMG (cores 34-47).
Note however within each CMG, the thread index does not necessarily match the CPU index (e.g., the 19th thread is bound to the 25th CPU).
If we wish to ensure that the order of threads matches the order of CPUs, we can explicitly define the binding assignments. The syntax for doing this is
location:number:stride
For example:
export OMP_PLACES="{0}:12,{12}:12,{24}:12,{36}:12"
The above syntax designates 4 different locations, each of which will receive 12 cores
(we have omitted the stride). Within the first CMG, thread 0 will be bound to core
0, thread 1 to core 1, etc. The same logic is applied to the cores in the other CMGs
as well, such that each thread index will match the core index.
Similarly,
export OMP_PLACES="{0:12},{12:12},{24:12},{36:12}"
will specify 4 locations that each receive 12 cores. However, in this case the thread index will not necessarily match the core index.
This type of explicit binding assignment grammar can be applied in a variety of different
ways to accomodate a different scenarios. See here, the TACC guide to OpenMP affinity for several additional examples.
Uses may also wish to use OpenMP in conjuction with MPI. Some instructions and examples
for thread binding under hybrid OMP-MPI scenarios can be found here, the MPI thread control entry on this page.
How do I control threads and CPUs on Ookami using MPI flags?
Using MPI options to manage resources on Ookami
While Slurm provides options for managing thread and CPU resources, some Ookami users may wish to exert additional control over resources using MPI-specific flags. This article will discuss some useful options available for OpenMPI and MVAPICH.
OpenMPI
OpenMPI provides several optional flags that are useful for flexibly assigning resources and determining how processes are mapped to CPUs. Of particular note, the "--map-by" option allows the user to map processes in a variety of diferrent ways.
Arguments supplied to the "--map-by" flag typically have the following syntax:
--map-by ppr:x:<object>:pe=n
Here, ppr stands for "processes per resource" and x indcates the number of processes to be assigned. The object is the resource that processes will be mapped to and can take many forms, including node, core, socket, numa, or hwthread. Additionally, pe is the "processing element" (e.g., OpenMP thread), and n indicates how many such elements will be generated per process.
Another option that is useful for investigating how job resources are bound is the "--report-bindings" flag that can be provided to "mpiexec". This flag will report how each MPI_COMM_WORLD (MCW) rank is assigned to the specified resources.
A few "Hello World" examples will illustrate how these options can be set to manage resources. Source code for "Hello World" examples can be found at:
/lustre/projects/global/samples/HelloWorld
The first example will use 1 Node, 1 process, and 48 threads:
#!/usr/bin/env bash

#SBATCH --job-name=test_openmpi
#SBATCH --output=test_openmpi.log
#SBATCH -N 1
#SBATCH --time=00:05:00
#SBATCH --cpus-per-task=48
#SBATCH -p short

# specify message size threshold for using the UCX Rendevous Protocol
export UCX_RNDV_THRESH=65536

# use high-performance rc and xpmem transports where possible
export UCX_TLS=rc,xpmem

# control how much information about the transports is printed to log
export UCX_LOG_LEVEL=info


module load slurm
module load openmpi/gcc8/4.1.2

mpicc -fopenmp /lustre/projects/global/samples/HelloWorld/hybrid_hello.c -o hybrid_hello

mpiexec --map-by ppr:1:node:pe=48 --report-bindings ./hybrid_hello
In the above, we have compiled a "Hello World" code with mpicc, and then executed it with mpiexec. The UCX environment variables that are set will control which transports are used and how much information about the transports is printed. Please see here, the UCX configuration documentation for more information about the UCX variables.
Importantly, the --map-by statement binds 1 process to a single node, with 48 thread per process.
The --report-bindings flag produces output to show what node, core, and thread each MCW was mapped to:
[fj131:21758] MCW rank 0 is not bound (or bound to all available processors)
In the output we see that there are 48 total "Hello World" statements printed, all from different threads of the same process:
Hello from thread 43 out of 48 from process 0 out of 1 on fj131
Hello from thread 5 out of 48 from process 0 out of 1 on fj131
Hello from thread 12 out of 48 from process 0 out of 1 on fj131
Hello from thread 17 out of 48 from process 0 out of 1 on fj131
Hello from thread 25 out of 48 from process 0 out of 1 on fj131
...
(output truncated)
Now, let's modify this example to use 2 nodes, 4 processes per node, and 2 OpenMP threads per process:
#!/usr/bin/env bash

#SBATCH --job-name=test_openmpi
#SBATCH --output=test_openmpi.log
#SBATCH -N 2
#SBATCH --time=00:05:00
#SBATCH --cpus-per-task=2
#SBATCH -p short

# specify message size threshold for using the UCX Rendevous Protocol
export UCX_RNDV_THRESH=65536

# use high-performance rc and xpmem transports where possible
export UCX_TLS=rc,xpmem

# control how much information about the transports is printed to log
export UCX_LOG_LEVEL=info

module load slurm
module load openmpi/gcc8/4.1.2

mpicc -fopenmp /lustre/projects/global/samples/HelloWorld/hybrid_hello.c -o hybrid_hello

mpiexec --map-by ppr:4:node:pe=2 --report-bindings ./hybrid_hello
In this case, we have used an Sbatch flag to set 2 CPUs per task, changed the value
of ppr to 4 and changed the pe value to 2 in the --map-by flag. The output shows expected 8 total ranks/processes spread across two nodes,
with two threads per rank:
[fj126:27130] MCW rank 3 bound to socket 0[core 6[hwt 0]], socket 0[core 7[hwt 0]]:
[././././././B/B/./././.][./././././././././././.][./././././././././././.][./././././././././././.]
[fj126:27130] MCW rank 0 bound to socket 0[core 0[hwt 0]], socket 0[core 1[hwt 0]]:
[B/B/./././././././././.][./././././././././././.][./././././././././././.][./././././././././././.]
[fj126:27130] MCW rank 1 bound to socket 0[core 2[hwt 0]], socket 0[core 3[hwt 0]]:
[././B/B/./././././././.][./././././././././././.][./././././././././././.][./././././././././././.]
[fj126:27130] MCW rank 2 bound to socket 0[core 4[hwt 0]], socket 0[core 5[hwt 0]]:
[././././B/B/./././././.][./././././././././././.][./././././././././././.][./././././././././././.]
[fj127:20627] MCW rank 6 bound to socket 0[core 4[hwt 0]], socket 0[core 5[hwt 0]]:
[././././B/B/./././././.][./././././././././././.][./././././././././././.][./././././././././././.]
[fj127:20627] MCW rank 7 bound to socket 0[core 6[hwt 0]], socket 0[core 7[hwt 0]]:
[././././././B/B/./././.][./././././././././././.][./././././././././././.][./././././././././././.]
[fj127:20627] MCW rank 4 bound to socket 0[core 0[hwt 0]], socket 0[core 1[hwt 0]]:
[B/B/./././././././././.][./././././././././././.][./././././././././././.][./././././././././././.]
[fj127:20627] MCW rank 5 bound to socket 0[core 2[hwt 0]], socket 0[core 3[hwt 0]]:
[././B/B/./././././././.][./././././././././././.][./././././././././././.][./././././././././././.]
Hello from thread 0 out of 2 from process 0 out of 8 on fj126
Hello from thread 1 out of 2 from process 0 out of 8 on fj126
Hello from thread 0 out of 2 from process 1 out of 8 on fj126
Hello from thread 1 out of 2 from process 1 out of 8 on fj126
Hello from thread 1 out of 2 from process 2 out of 8 on fj126
Hello from thread 0 out of 2 from process 2 out of 8 on fj126
Hello from thread 0 out of 2 from process 5 out of 8 on fj127
Hello from thread 1 out of 2 from process 5 out of 8 on fj127
Hello from thread 0 out of 2 from process 6 out of 8 on fj127
Hello from thread 1 out of 2 from process 6 out of 8 on fj127
Hello from thread 0 out of 2 from process 3 out of 8 on fj126
Hello from thread 1 out of 2 from process 3 out of 8 on fj126
Hello from thread 0 out of 2 from process 7 out of 8 on fj127
Hello from thread 1 out of 2 from process 7 out of 8 on fj127
Hello from thread 0 out of 2 from process 4 out of 8 on fj127
Hello from thread 1 out of 2 from process 4 out of 8 on fj127
In some cases, it may be useful to allocate processes based on numa or core memory groups (CMG) to improve efficiency:
#!/usr/bin/env bash

#SBATCH --job-name=test_openmpi
#SBATCH --output=test_openmpi.log
#SBATCH -N 2
#SBATCH --time=00:05:00
#SBATCH --cpus-per-task=4
#SBATCH -p short

# specify message size threshold for using the UCX Rendevous Protocol
export UCX_RNDV_THRESH=65536

# use high-performance rc and xpmem transports where possible
export UCX_TLS=rc,xpmem

# control how much information about the transports is printed to log
export UCX_LOG_LEVEL=info

module load slurm
module load openmpi/gcc8/4.1.2

mpicc -fopenmp /lustre/projects/global/samples/HelloWorld/hybrid_hello.c -o hybrid_hello

mpiexec --map-by ppr:1:numa:pe=4 --report-bindings ./hybrid_hello
In the above example, we have changed the mapping object from node to numa, and we are launching 1 process per numa, each with four threads.
The result, once again, is 8 total processes spread across the two nodes:
...
Hello from thread 3 out of 4 from process 0 out of 8 on fj127
Hello from thread 2 out of 4 from process 0 out of 8 on fj127
Hello from thread 0 out of 4 from process 1 out of 8 on fj127
Hello from thread 2 out of 4 from process 7 out of 8 on fj128
Hello from thread 0 out of 4 from process 7 out of 8 on fj128
Hello from thread 2 out of 4 from process 6 out of 8 on fj128
...
But the way that the MCW ranks have been allocated is now quite different:
[fj127:25164] MCW rank 1 bound to socket 1[core 12[hwt 0]], socket 1[core 13[hwt 0]], socket 1[core 14[hwt 0]], socket 1[core 15[hwt 0]]:
[./././././././././././.][B/B/B/B/./././././././.][./././././././././././.][./././././././././././.]
[fj127:25164] MCW rank 2 bound to socket 2[core 24[hwt 0]], socket 2[core 25[hwt 0]], socket 2[core 26[hwt 0]], socket 2[core 27[hwt 0]]:
[./././././././././././.][./././././././././././.][B/B/B/B/./././././././.][./././././././././././.]
[fj128:25248] MCW rank 6 bound to socket 2[core 24[hwt 0]], socket 2[core 25[hwt 0]], socket 2[core 26[hwt 0]], socket 2[core 27[hwt 0]]:
[./././././././././././.][./././././././././././.][B/B/B/B/./././././././.][./././././././././././.]
[fj128:25248] MCW rank 5 bound to socket 1[core 12[hwt 0]], socket 1[core 13[hwt 0]], socket 1[core 14[hwt 0]], socket 1[core 15[hwt 0]]:
[./././././././././././.][B/B/B/B/./././././././.][./././././././././././.][./././././././././././.]

...

(truncated for clarity)
Unlike our previous examples, each MCW rank is now bound to a separate numa/CMG (referred to as sockets), and there are 4 threads spread across each numa/CMG.
Finally, let's run an example involving several nodes, with 1 process per numa/CMG
of the node and each process using all 12 cores available to that socket:
#!/usr/bin/env bash

#SBATCH --job-name=test_openmpi
#SBATCH --output=test_openmpi.log
#SBATCH -N 8
#SBATCH --time=00:05:00
#SBATCH --cpus-per-task=12
#SBATCH -p short

# specify message size threshold for using the UCX Rendevous Protocol
export UCX_RNDV_THRESH=65536

# use high-performance rc  and xpmem transports where possible
export UCX_TLS=rc,xpmem

# control how much information about the transports is printed to log
export UCX_LOG_LEVEL=info

module load slurm
module load openmpi/gcc8/4.1.2

mpicc -fopenmp /lustre/projects/global/samples/HelloWorld/hybrid_hello.c -o hybrid_hello

mpiexec --map-by ppr:1:numa:pe=12 --report-bindings ./hybrid_hello
In this case, 32 processes--each with 12 threads--have been generated across 8 nodes:
...
Hello from thread 11 out of 12 from process 4 out of 32 on fj128
Hello from thread 6 out of 12 from process 16 out of 32 on fj131
...
Each MCW rank has used all the CPUs within a given numa/CMG. For example, here are
the reported bindings for one MCW rank:
[fj127:28077] MCW rank 0 bound to socket 0[core 0[hwt 0]], socket 0[core 1[hwt 0]], socket 0[core 2[hwt 0]], socket 0[core 3[hwt 0]],
socket 0[core 4[hwt 0]], socket 0[core 5[hwt 0]], socket 0[core 6[hwt 0]], socket 0[core 7[hwt 0]],
socket 0[core 8[hwt 0]], socket 0[core 9[hwt 0]], socket 0[core 10[hwt 0]], socket 0[core 11[hwt 0]]:
[B/B/B/B/B/B/B/B/B/B/B/B][./././././././././././.][./././././././././././.][./././././././././././.]
In this case, we can see that the 12 threads for MCW rank 0 are all found within a single numa/CMG. Each process was confined to a single numa/CMG, which may help increase the efficiency of the work.
Many other CPU-mapping configurations are possible. Please see the OpenMPI documentation for additional details.
MVAPICH2
The following example demonstrates how to run a simple MPI job using the Mvapich2 implementation of MPI.
Note that on Ookami, Mvapich2 has been compiled with explicit Slurm support. This means that MPI jobs should be launched using the "srun" command instead of the more typical "mpirun" or "mpiexec" commands:
#!/usr/bin/env bash

#SBATCH --job-name=gccmpitest
#SBATCH --output=gcc_mpi_hello.log
#SBATCH --ntasks-per-node=48
#SBATCH -N 4
#SBATCH --time=00:05:00
#SBATCH -p short

# load slurm and mvapich2 compiled with gcc 8
module load slurm
module load  mvapich2/gcc8/2.3.5

# compile the hello world code with the MPI compiler
mpicc /lustre/projects/global/samples/HelloWorld/mpi_hello.c -o mpi_hello

# launch the MPI job with srun instead of mpirun or mpiexec
srun ./mpi_hello
In this case, we are creating a total of 192 "hello world" processes spread across 4 nodes. The output will look similar to the following:
Hello world from processor fj005, rank 145 out of 192 processors
Hello world from processor fj003, rank 82 out of 192 processors
Hello world from processor fj003, rank 83 out of 192 processors
Hello world from processor fj002, rank 1 out of 192 processors
Hello world from processor fj003, rank 49 out of 192 processors
Hello world from processor fj002, rank 34 out of 192 processors
Hello world from processor fj002, rank 2 out of 192 processors
...
More examples coming soon...
How do I control threads and CPUs on Ookami using Slurm?
Using Slurm to manage resources on Ookami
The Slurm Workload Manager provides a variety of ways for users to control how computational resources are managed when running a job on Ookami. This article will discuss Slurm options that can be specified to control resource usage, particularly with MPI and OpenMP.
Several useful flags can be supplied to sbatch/srun/salloc to control job resource usage. These include:
Optional Flag | Behavior |
|---|---|
--nodes | No. of nodes to use for the job |
--ntasks | No. of tasks (e.g., commands to run in parallel) to be run |
--ntasks-per-node | No. of tasks to use per node. Often, this will be the number of cores available on the compute node. |
--ntasks-per-core | No. of tasks to use per core |
--ntasks-per-socket | No. of tasks to run per CPU socket |
--sockets-per-node | No. of sockets to use (up to 4) per node |
--threads-per-core | No. of threads to use (e.g., with OpenMP) per core. Using more than one thread per core may degrade performance and is generally not recommended. |
--cpu-bind | Use of this flag allows detailed control of binding tasks to CPUs. |
These options can be used in combination to control how the workload is spread across separate nodes, and across cores and threads within a single node. This will be illustrated using several "Hello World" examples (please read the Getting Started Guide first). Source code for these examples can be found at:
/lustre/projects/global/samples/HelloWorld
The first example will utilize two compute nodes and execute 1 MPI task per core:
#!/usr/bin/env bash

#SBATCH --job-name=onetaskpercore
#SBATCH --output=onetaskpercore.log
#SBATCH --ntasks-per-node=48
#SBATCH -N 2
#SBATCH --time=00:05:00
#SBATCH -p short

module load slurm
module load CPE
module load cray-mvapich2_nogpu_sve/2.3.6

# this example will use 1 MPI task per CPU

mpicc /lustre/projects/global/samples/HelloWorld/mpi_hello.c -o mpi_hello

srun ./mpi_hello
The above script launches 48 MPI tasks per node and 2 nodes total. The outcome is a Hello World statement from each core across two nodes:
Hello world from processor fj003, rank 49 out of 96 processors
Hello world from processor fj002, rank 34 out of 96 processors
Hello world from processor fj003, rank 50 out of 96 processors
...
Parallelization can also be accomplished using OpenMP threads on a single node:
#!/usr/bin/env bash

#SBATCH --job-name=48openmpthreads
#SBATCH --output=48openmpthreads.log
#SBATCH --ntasks=1
#SBATCH -N 1
#SBATCH --cpus-per-task=48
#SBATCH --time=00:05:00
#SBATCH -p short

module load slurm

# this example will use 1 task and 48 OpenMP threads
omp_threads=$SLURM_CPUS_PER_TASK
export OMP_NUM_THREADS=$omp_threads

gcc -fopenmp /lustre/projects/global/samples/HelloWorld/openMP_hello.c -o openMP_hello

./openMP_hello
In the above example, a single node is requested to run 1 task split across 48 cores. The $SLURM_CPUS_PER_TASK environment variable corresponds to the 48 cores per task that we requested and is used to set the OpenMP environment variable that determines how many threads are used. After compiling and running the script, the outcome is a "Hello World" statement from each of the 48 threads run on the node:
Hello World... from thread = 0
Hello World... from thread = 41
Hello World... from thread = 42
...
Another option is to combine parallelization with MPI and OpenMP across and within nodes:
#!/usr/bin/env bash

#SBATCH --job-name=twompiproc
#SBATCH --output=twompiproc.log
#SBATCH --ntasks=2
#SBATCH -N 2
#SBATCH --cpus-per-task=48
#SBATCH --time=00:05:00
#SBATCH -p short

module load slurm
module load CPE
module load cray-mvapich2_nogpu_sve/2.3.6

# this example will use 2 MPI tasks spread across two nodes with 48 OpenMP threads per task

# Disable CPU affinity which may degrade performance
export MV2_ENABLE_AFFINITY=0

omp_threads=$SLURM_CPUS_PER_TASK
export OMP_NUM_THREADS=$omp_threads

mpicc -fopenmp /lustre/projects/global/samples/HelloWorld/hybrid_hello.c -o hybrid_hello

srun ./hybrid_hello
This script will launch two MPI tasks--one per node--and then launch 48 OpenMP threads per task. As before, we use the Slurm environment variable $SLURM_CPUS_PER_TASK to control the number of OpenMP threads. In addition, we have set the value of a new environment variable, $MV2_ENABLE_AFFINITY, to zero, which disables CPU affinity and may prevent performance degradation for more complicated tasks.
The result is 96 total "Hellos" from each thread that are spread across 2 processes
and two nodes. Each process is contained to a single node:
Hello from thread 0 out of 48 from process 0 out of 2 on fj003
Hello from thread 7 out of 48 from process 0 out of 2 on fj003
Hello from thread 8 out of 48 from process 0 out of 2 on fj003
...
Hello from thread 3 out of 48 from process 1 out of 2 on fj004
Hello from thread 2 out of 48 from process 1 out of 2 on fj004
Hello from thread 1 out of 48 from process 1 out of 2 on fj004
Advanced users may sometimes want combine MPI and OpenMP but limit processes to stay within each of the 4 physical CPU sockets on each node. One final example illustrates how to do this:
#!/usr/bin/env bash

#SBATCH --job-name=onempipersocket
#SBATCH --output=onempipersocketc.log
#SBATCH --sockets-per-node=4
#SBATCH -N 2
#SBATCH --ntasks-per-socket=1
#SBATCH --time=00:05:00
#SBATCH -p short

module load slurm
module load CPE
module load cray-mvapich2_nogpu_sve/2.3.6

# this example will use 2 nodes with 1 MPI task per socket and 12 openmp threads per MPI task

# Disable CPU affinity which may degrade performance
export MV2_ENABLE_AFFINITY=0

export OMP_NUM_THREADS=12

mpicc -fopenmp /lustre/projects/global/samples/HelloWorld/hybrid_hello.c -o hybrid_hello

srun ./hybrid_hello
Here, we have requested 2 nodes, with 1 task per socket. We have also requested all 4 sockets per node. This time we set $OMP_NUM_THREADS manually to 12 in order to split core usage evenly across the 4 sockets.
The outcome is once again 96 "Hellos", but this time they are spread across 4 processes per node, with 12 threads per process:
Hello from thread 3 out of 12 from process 0 out of 8 on fj002
...
Hello from thread 0 out of 12 from process 1 out of 8 on fj002
...
Hello from thread 1 out of 12 from process 2 out of 8 on fj002
...
Hello from thread 1 out of 12 from process 3 out of 8 on fj002
...
Hello from thread 7 out of 12 from process 4 out of 8 on fj003
...
Hello from thread 6 out of 12 from process 5 out of 8 on fj003
...
Hello from thread 9 out of 12 from process 6 out of 8 on fj003
...
Hello from thread 0 out of 12 from process 7 out of 8 on fj003
...
Hopefully it is clear from these examples that users can exert relatively fine-grained control over nodes, CPUs and threads on Ookami using Slurm. Please note that there are multiple ways to accomplish the same task, and the examples above just illustrate one particular route.
While these examples show how to control behavior on a per-job basis, users may also pass most of the same flags to "srun" within the script in order to exert additional control on a per-task basis. The srun flag "--cpu-binding" can also allows fine-grained control of CPUs used in the tasks called by srun. Please see this detailed discussion for more information and additional options.
How to access and use the NVIDIA Grace CPUs
Using Ookami's NVIDIA Grace CPUs
We are pleased to announce the addition of two NVIDIA Grace superchips to Ookami. These new nodes with 144 cores each are now available for your testing and experimental projects.
Learn more about the NVIDIA Grace superchip:
Access Details:
You can access these CPUs via SSH from any other node of the cluster, i.e.
ssh fj-grace1
or
ssh fj-grace2
Using the nodes:
Following compilers will work on the Grace nodes:
- gcc/13.2.0
- Nvidia nvhpc
- LLVM
- Arm
Please also have a look at the
NVIDIA Grace Performance Tuning Guide
Recommended flags for the LLVM compiler (see the NVIDIA Grace Performance Tuning Guide)
| LLVM Compiler | ||
| Optimization Level | Flags | Notes |
|---|---|---|
| Aggressive | -Ofast -mcpu=neoverse-v2 | Enable fast math optimizations |
| Moderate | -O3 -mcpu=neoverse-v2 | Recommended in most cases |
| Conservative | -O3 -ffp-contract=off -mcpu=neoverse-v2 | Recommended in most cases |
Recommended flags for the GCC compiler (see the NVIDIA Grace Performance Tuning Guide)
| GCC Compiler | ||
| Optimization Level | Flags | Notes |
|---|---|---|
| Aggressive | -Ofast -mcpu=neoverse-v2 | Enable fast math optimizations |
| Moderate | -O3 -mcpu=neoverse-v2 | Recommended in most cases |
Power Measurements:
The power on the nodes is measured using the system's ipmi tool. You can access the data in the following folder
/lustre/admin/power_monitoring/power/year/year&month/month&day
e.g. the data for 05/01/2024 would be located in
/lustre/admin/power_monitoring/power/2024/202405/0501
In the folder are several files, each containing the power measurements of a single node. The naming of the files reads as power_orginfo_ IP address of the node _ date.csv
The IP address of the grace nodes are
- 10.10.1.200 for fj-grace1
- 10.10.1.201 for fj-grace2
Hence the file containing the measurements on 05/01/2024 for fj-grace1 would be
/lustre/admin/power_monitoring/power/2024/202405/0501/power_orginfo_10.10.1.200_20240501.csv
The file contains two columns. The first column is the time of the day and the second the power measurement in W.
Node Usage and Policy:
The Grace CPU nodes are shared resources. As they are primarily intended for testing purposes, we kindly ask you to manage your usage time and computational load considerately to allow equitable access for all users.
We hope you find these new additions valuable for your research and development efforts. Should you have any questions or require further assistance, please do not hesitate to contact our support team.
Storage and data
What are Ookami's storage options?
Ookami storage policies
There is a 0.8 Pbyte high-performance, Lustre file system, which is divided into home, project, and scratch areas. The home and project areas are backed up daily.
Home Directory
- All users on Ookami have their own home directory which is accessible only by them. The default size is 20 Gbyte, but an increase can be requested.
Scratch Directory
- The scratch directory has no quota, but has a policy of deleting files older than 20 days. There is a limit on the total number of files a user can create per directory. This space is NOT backed up.
Project Space
- Upon request from the project's PI, each project will be granted a shared (project) directory, accessible only to project members. The default is 1TB, which can be increased to multiple terabytes. Project directories larger than 5 TB will have to renew their requests annually and be prepared to move their data if space becomes limited. Large project directories may not be backed up.
Summary
| Location | Size | Backed Up? | Shareable? | Cleared? |
|---|---|---|---|---|
| /lustre/home/<netid> | 20GB | Yes | No | never |
| /lustre/scratch/<netid> | 20TB | No | No | 30 days |
| /lustre/projects/<your_group>* | up to 5TB | Yes** | Yes | per request |
*Project directories are granted upon request from the group's PI
**Some large project directories may not be backed up
Setting Permissions in Project Spaces
Setting Permissions in Project Spaces
All files in UNIX are owned by both a group and a user. There exist different sets of permissions for the group and user owner of every file. Each project folder on Ookami is associated with a group that all users in the research team belong to. If group members aren't careful, files they place there may not be accessible to other group members because the group owner or group permissions are not correct. You can use the command ls -l to check if files in your project folder have the right group owner and permissions. For example, if John Smith has access to a project folder called SmithGroup, he should see this:
[jsmith@login2 SmithGroup]$ ls -l
total 0
-rw-rw---- 1 jsmith SmithGroup 0 Sep 16 15:27 file.txt
The group owner is SmithGroup and characters 5 through 7 in the ouput are rw-, meaning members of SmithGroup have read and write permissions for the file. Here are two examples of incorrect permissions:
[jsmith@login2 SmithGroup]$ ls -l
total 0
-rw-rw---- 1 jsmith jsmith 0 Sep 16 15:27 file.txt

[jsmith@login2 SmithGroup]$ ls -l
total 0
-rw------- 1 jsmith SmithGroup 0 Sep 16 15:27 file.txt
In the first example, the group permissions are set correctly but the group owner is jsmith, so members of SmithGroup don't have read and write permissions. In the second example, the group owner is SmithGroup, but SmithGroup is not provided the proper read and write permissions.
When creating new files and directories in the root directory of your project space, they should default to the correct group owner and permissions. Problems can occcur when copying or moving files into your project space from other locations, depending on what method you use. We recommend using rsync with the proper flags whenever copying files into a project space.
rsync command
By default, rsync will not use the correct permissions when copying files into your project space. However, it offers multiple flags that will allow you to set them properly. Instead of running this command to quickly copy a file into your project folder:
rsync -avz file.txt /gpfs/projects/SmithGroup
Use this command:
rsync -avz --no-g --no-p --chmod=ugo=rwX file.txt /gpfs/projects/SmithGroup
This will ensure that the group owner is SmithGroup and other members of SmithGroup have the correct read, write, and execute permissions on the file.
scp and cp command
The scp and cp command will set the correct group owner, but not the right permissions. If you used one of these commands to copy your files into your project space, you should also run the following command to correct group permissions:
find <DIRECTORY> -user $USER -exec chmod g=u {} \;
This will update group permissions to reflect your own user permissions for all the files you own in the given <DIRECTORY>.
mv command
The mv command is the fastest way to get files into your project space since it's not actually copying the contents of the file, but instead just changing its location in the file system. However, it has no support for updating permissions. You must manually set correct permissions after the files have been moved to allow your group members access. This can be done like so:
find <DIRECTORY> -user $USER -exec chgrp <GROUPNAME> {} \; -exec chmod g=u {} \;
If you are copying any folders using the move command, you must also update the special setgid bit (see below for explanation).
Subdirectories
Sometimes, even when using the rsync command with the flags we recommended above, you may find group ownership is still set incorrectly. This is probably because you are copying files into a subdirectory of your project space that does not have the special setgid bit enabled. It should be enabled by default when creating subdirectories in your project space, but the mv command, for example, will not enable the setgid bit if moving directories into your project space. The setgid bit of a directory controls the default group of files and subdirectories created within that directory. Earlier, we mentioned that permissions for newly created files will always be set correctly in the root directory of your project space because all project directories have the setgid bit enabled. You can confirm this with ls -l:
[jsmith@login2 SmithGroup]$ ls -la
total 0
drwxrws---+ 1 jsmith jsmith 0 Sep 16 15:27 .
Notice the 7th character of the output for the current directory (signified by ".") is the letter s. This is what causes all files and subdirectories created in the SmithGroup project folder to be owned by the SmithGroup by default (subdirectories also inherit the setgid bit by default). If you have a folder within your project space without an s as the 7th character of the permissions list, you can set the setgid bit like so:
chmod -R g+s <DIRECTORY>
You'll also probably need to update group ownership and permissions for everything in that directory like so:
find <DIRECTORY> -user $USER -exec chgrp <GROUPNAME> {} \; -exec chmod g=u {} \;
Transferring Files to Ookami
Transferring Files to and from Ookami
DUO Authentication
Just like when you log in to Ookami, transferring files requires Two-Factor Authentication via DUO. However, some file transferring software will initiate many separate connections to Ookami, which can generate lots of DUO pushes and lock your DUO account. If this happens, you'll receive an email saying that your account is locked, and you must reply to confirm that it should be unlocked. To avoid this, connect to Stony Brook's VPN before making any connections to Ookami. Please see DoIT's VPN Homepage for more information on requesting a VPN account and setting up a connection. You'll need to authenticate once with DUO to connect to the VPN, but after this, all connections you make to Ookami through the VPN will bypass DUO.
Note: If you're on campus and connected to WolfieNet-Secure, you won't be able to connect to Stony Brook's VPN. One solution is to use WolfieNet-Guest to connect to the VPN. But if you want the added security and speed of WolfieNet-Secure, you'll have to use a method of transferring files that won't cause DUO to spam you with authentication requests. See our recommendations below.
If you experience any problems that involve endless hanging, lost connections, and/or lack of DUO pushes while attempting to transfer files, try setting the DUO_PASSCODE variable in your ~/.bashrc on Ookami. Our Logging In FAQ page, the SeaWulf login guide has more information about this variable and how to set it. You can also set a default DUO device and action when logging in non-interactively (i.e. using sftp, scp, or similar software) by visiting Stony Brook's DUO self service portal.
Windows
MobaXTerm
We recommend that you use MobaXTerm for transferring files to and from a Windows machine. After starting MobaXterm, select "New Session", and choose "SFTP":
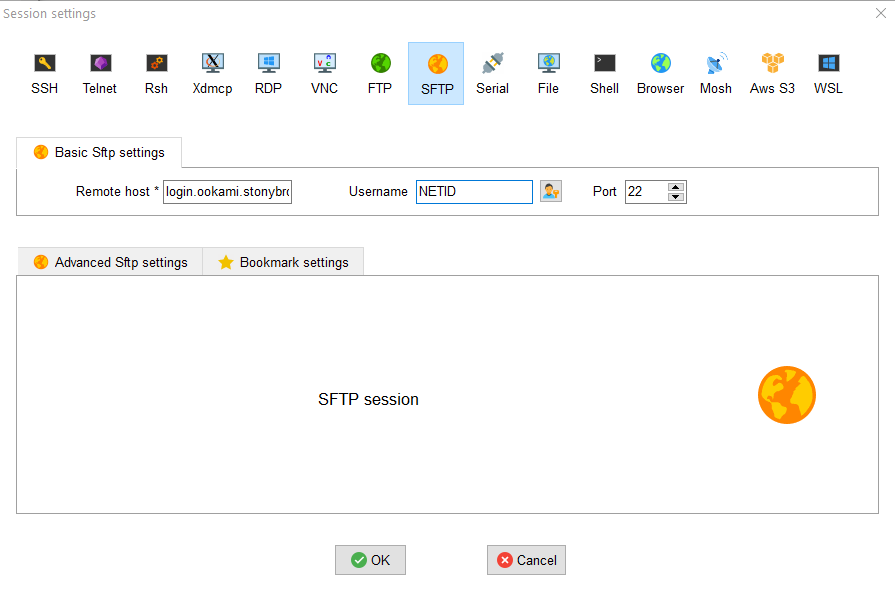
After providing your login information, you will see your local file system on the left, while your home directory on the cluster is shown on the right:
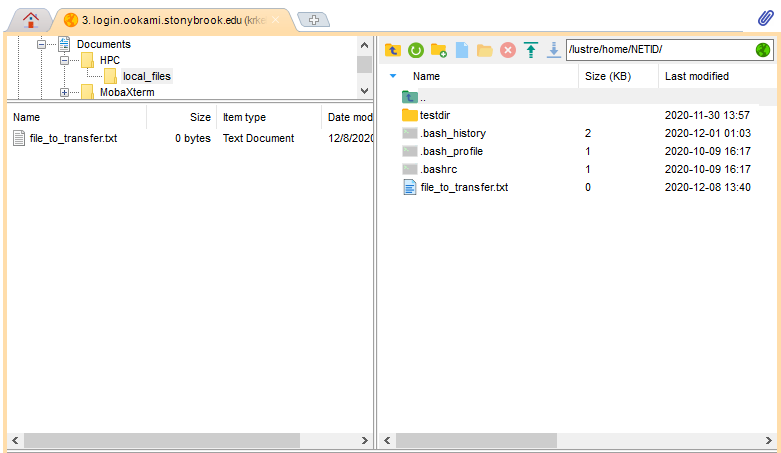
To transfer files back and forth, simply navigate to the appropriate local and remote directories on each side of the screen, and then drag and drop.
You may notice that when using MobaXTerm for an SSH session to Ookami, a small sidebar will appear on the left side of your screen with an SFTP browser. We recommend that you do not use this browser unless you are using a VPN. Without a VPN, it will send you DUO pushes every time you upload or download a file, but creating a full SFTP session as described above will not.
WinSCP
Another program that will allow you to transfer files to and from Ookami using a Graphical User Interface is WinSCP. WinSCP can be downloaded here, the WinSCP download page. Use the following settings to start an SFTP session using WinSCP:
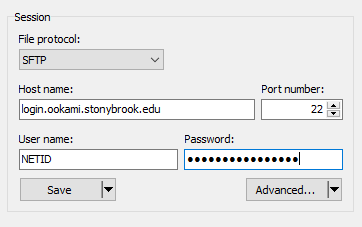
You must use DUO to authenticate, unless you are connected to Stony Brook's VPN. Once connected, ensure you keep the Transfer Settings set to default to avoid having to authenticate with DUO again. You may then transfer files by clicking and dragging from your local machine's directory to a directory on Ookami.
MacOS/Linux
MacOS/Linux users who access Ookami via a terminal program can transfer files back and forth using either sftp or scp command line functions. Example syntax for scp can be found here, a guide to the scp command, while sftp examples can be found here, a guide to sftp command line usage. Please note that without Stony Brook's VPN, every individual scp command you run will require DUO authentication. For this reason, we recommend using scp for one time transfers of large files or directories.
One way to minimize the number of DUO authentications needed is to copy multiple files with one scp command:
scp file1 file2 file3 NETID@login.ookami.stonybrook.edu:subdirectory
or using wildcards to transfer all files of a particular type (in this case, .txt files):
scp *.txt NETID@login.ookami.stonybrook.edu:subdirectory
If you need to frequently make different small transfers back and forth as you work, we recommend you keep an sftp session open rather than several scp commands.
Processing HIPAA Data on Ookami
Processing HIPAA Data on Ookami
Presently, the Ookami cluster has NOT been approved for HIPAA data or any data associated with privacy or liability concerns. Consequently, use of this system to process ePHI or other data that falls under the purview of HIPAA and privacy guidelines is in violation of the act.
Performance, monitoring and debugging
What profilers are available and how to use them
Profilers on Ookami
There are several profiling tools available on the system
gprof
You can find the documentation here, the gprof documentation. gprof collects information of a program during runtime. To profile your program use the ‘-pg’ option for compiling and linking.
cc -g -c myprog.c utils.c -pg
cc -o myprog myprog.o utils.o -pg
Run the program as usual ./myprog. The program will run as usual and produce its usual output. It might be a little bit slower due to the time spent collecting and writing the profile data.
The profile are written in a file called gmon.out which is located in the same directory as where you executed your program. Your program must exit normally for this file to be written.
Now you can run gprof to interpret the information. The gprof program prints a flat profile and a call graph on standard output. Optionally you
can pipe the output to a file and save it.
gprof ./myprog > gprof_output.txt
perf
You can find the documentation here, the Linux perf wiki. perfis a simple command line tool profiler. No special compiler flags have to be used for using perf.
The perf tool supports a list of measurable events. Run perf list to generate the full list of events that are allowed by the -e flag. Here is an example of how to output the duration and the cpu-cycles of a program
perf stat -e duration_time -e cpu-cycles ./myprog
Linaro forge tools (formerly arm forge)
To use these tools the appropriate modules have to be loaded
module load linaro/forge/23.0
Ookami has a limited number of licences for this toolchain. It's possible to get an
error when compiling with arm or using the forge tools, saying that there are no available
licences. If this happens, you have to wait until another user does not need his licence
anymore.
Documentation can be found here, the Linaro Forge documentation.
MAP
MAP is a source-level profiler and can show how much time was spent on each line of code.
Compile your code with -g to enable source code line details. The profile can be generated either by running the program
map --profile ./a.out
This will produce a .map file which can be loaded into the GUI
Or follow this Guide on how to use the Forge remote client on Ookami
Note:
If you want to use map with cray-mvapich you have to
export ALLINEA_WRAPPER_COMPILE
perf-report
Documentation can be found here, the Arm Performance Reports documentation.
perf-report takes samples of the program at a given intervall. Arm recommends to take at least 1000 samples. Hence choose your example such that the program runs long enough. Running your executable with
perf-report ./a.out
will produce a .html file which can be opened in a browser and provides high level analysis of the program (e.g. how much time is spent in compute, MPI and I/O). Also a .txt is produced, which gives the same information and can be opened in an editor.
Cray tools
Cray has various profiling tools in its toolsuite. Start by loading cray
module load CPE
PAPI
The documentation can be found here, the PAPI project site.
PAPI provides a consistent interface and methodology for use of the performance counter hardware found in most major microprocessors. In addition, PAPI provides access to a collection of components that expose performance measurement opportunites across the hardware and software stack.
perftools-lite
Documentation can be found here, the Cray perftools quick start guide.
PerfTools-lite is a simplified, easy-to-use version of the Cray Performance Measurement and Analysis Tool set. It provides basic performance analysis information automatically.
CrayPat
Documentation can be found here, the Cray performance tools installation guide.
CrayPat allows a user to re/instrument compiled binaries (executable files) and select aspects to specifically profile, including items such as MPI and OpenMP API’s, shared memory, and a/synchronous I/O.
Reveal
Documentation can be found here, the NERSC guide to Reveal.
Cray Reveal utilizes the Cray CCE program library for source code analysis, combined with performance data collected from CrayPat. Reveal helps to identify top time-consuming loops, with compiler feedback on dependency and vectorization.
TAU
Documentation can be found here, the TAU project site.
TAU Performance System® is a portable profiling and tracing toolkit for performance analysis of parallel programs written in Fortran, C, C++, UPC, Java, Python. You can find recordings of a TAU webinar on Ookami in our recordings section.
likwid
Documentation can be found here, the LIKWID repository on GitHub.
Likwid is a simple to install and use toolsuite of command line applications and a library for performance oriented programmers. It can be loaded via
module load likwid/5.1.1
OSACA
Documentation can be found here, the OSACA repository on GitHub.
For an innermost loop kernel in assembly, this tool allows automatic instruction fetching of assembly code and automatic runtime prediction including throughput analysis and detection for critical path and loop-carried dependencies. It can be loaded via
module load anaconda/3
source activate OSACA
perfalloc
Documentation can be found here, the perfalloc manual page.
To use this you probably have to swith off the PCP hardware counter collection.
You can do this by running the perfalloc command
/var/lib/pcp/pmdas/perfevent/perfalloc
Google Performance Tools
Documentation can be found here, the gperftools repository on GitHub.
The module can be loaded via
module load gperftools/2.9.1
What debuggers are available and how to use them
Debugging tools
gdb
gdb is the GNU debugging tool. gdb works by default without loading a specific module.
gdb4hpc
gdb4hpc is a parallel debugger for C, C++ and Fortran programs and is available on both the MACS and XCI systems as part of the Cray Programming Environment. It is a command line tool (based on gdb) and it can be used either to launch an application or attach to application which is already running.
It can be loaded via
module load CPE
module load gdb4hpc
ddt
ddt is Linaro's (formerly Arm's) debbuging tool. It can be launched via a GUI.
Guide on how to use the Forge remote client on Ookami
valgrind
valgrind is an instrumentation framework for building dynamic analysis tools. valgrind works by default without loading any additional modules.
valgrind4hpc
valgrind4hpc is a parallel memory debugging tool that aids in detection of memory leaks and errors in parallel applications.
It can be loaded via
module load CPE
module load valgrind4hpc
CCDB
This is the Cray Comparative Debugger, which can be loaded via
module load CPE
module load cray-ccdb
Note that SSH X forwarding must be activated to open the GUI.
ATP
Cray's Abnormal Termination Processing can be loaded via
module load CPE
module load atp
STAT
Cray's Stack Trace Analysis Tool can be loaded via
module load CPE
module load cray-stat
How can I monitor Ookami's usage?
How can I monitor Ookami's usage?
This is can be done using XDMoD. XDMoD provides information like CPU hours, job size and many more.
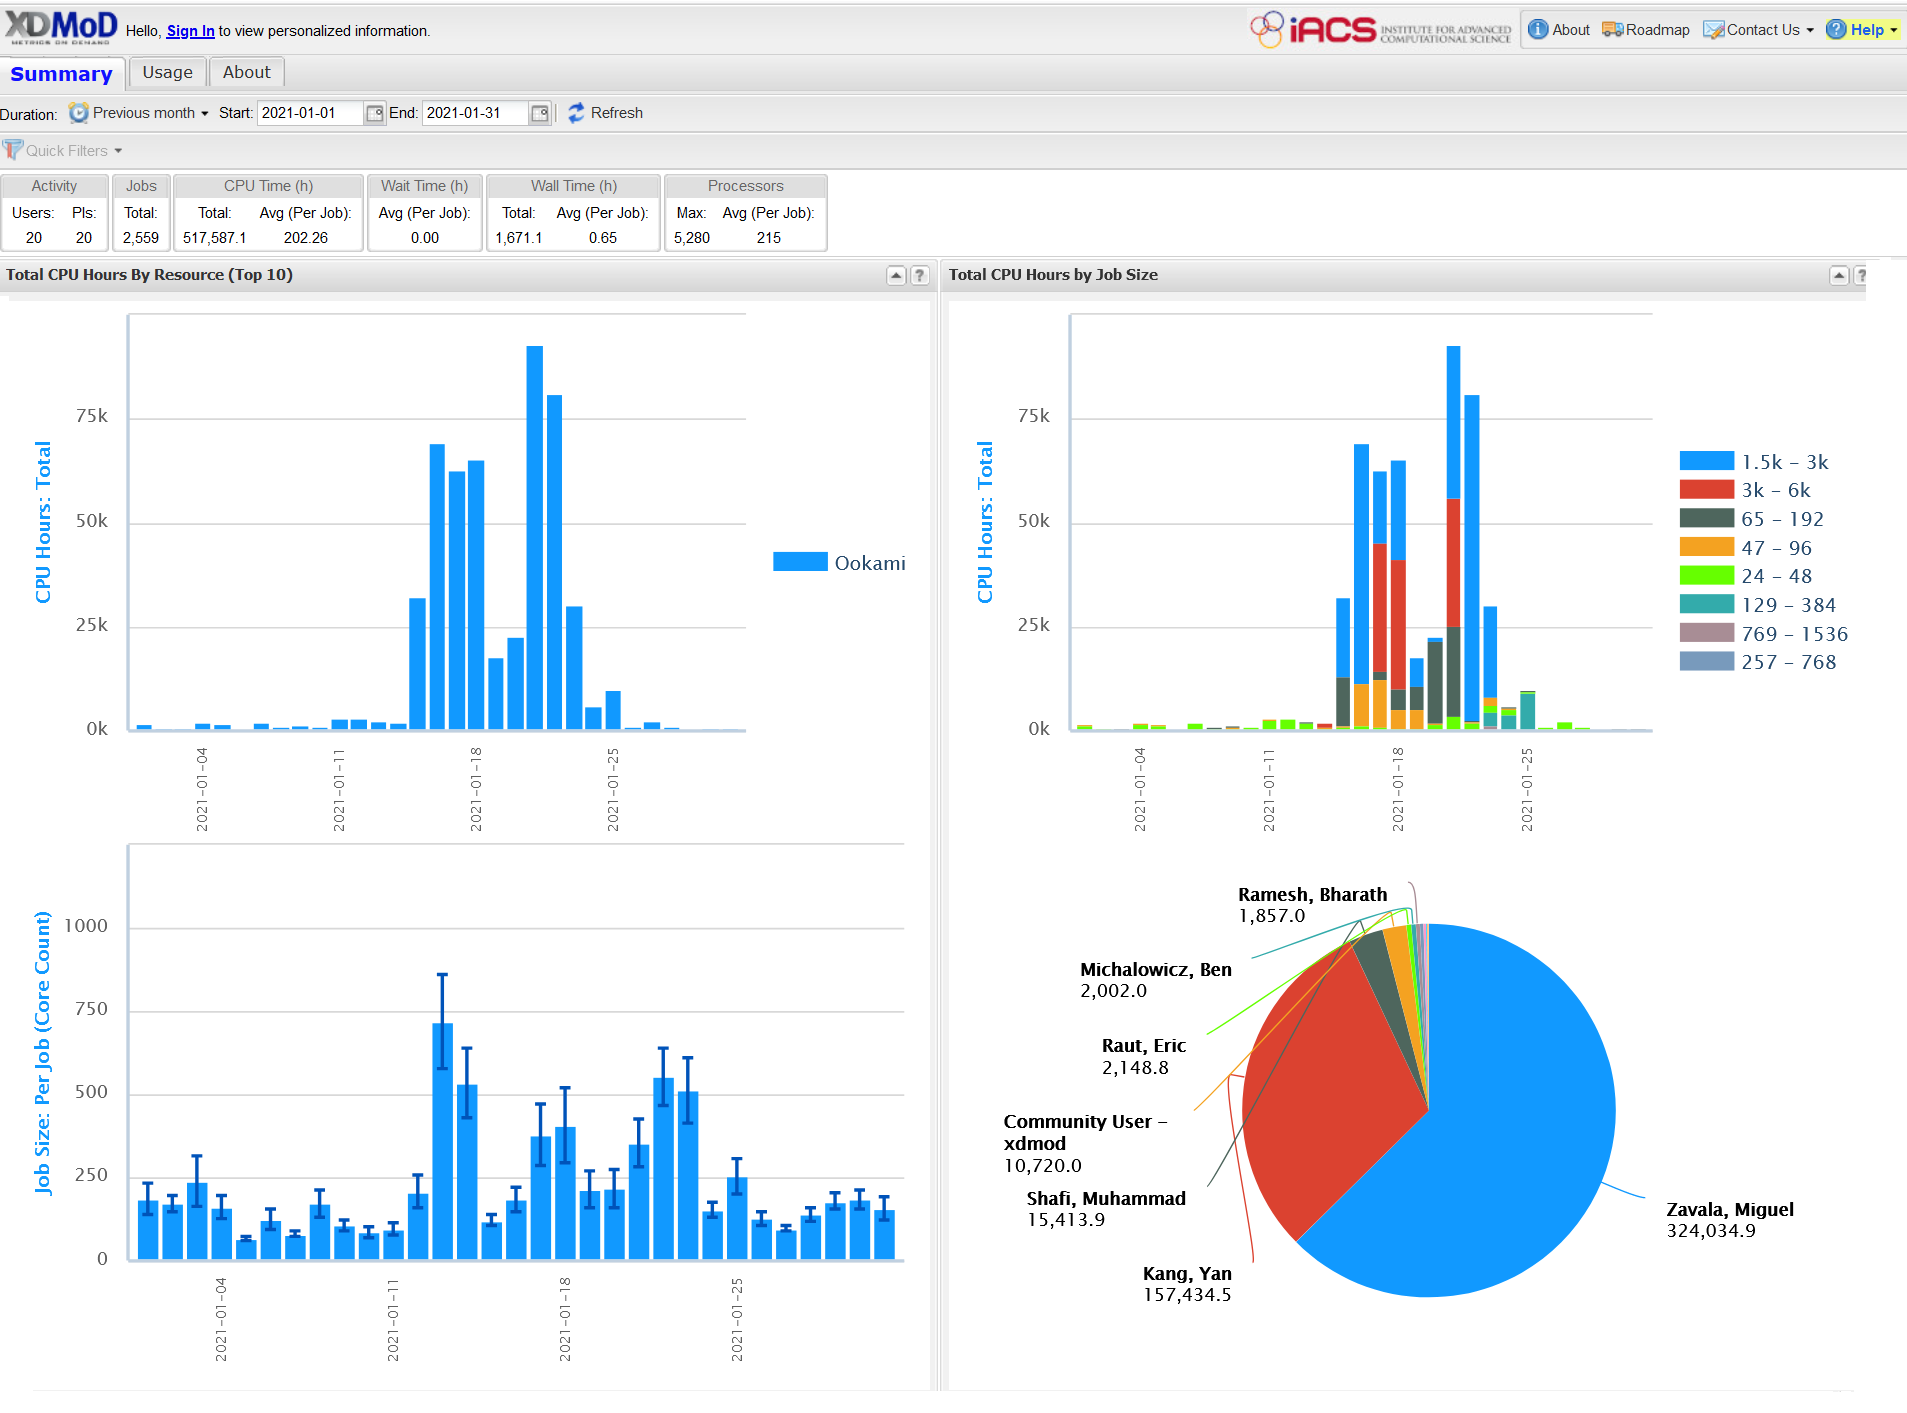
Creating an XDMoD account
Go to the XDMoD website.
- Click 'Sign In' on the top right
- Select the ‘Globus’ button to sign in via Globus Auth
- On the globus auth page sign in with your Stony Brook credentials
- Give Globus permission to send identity information to XDMoD (this only needs to be done once and is needed so that XDMoD shows information about your jobs)
- XDMoD permissions only allow you to view your own jobs. Use the contact us button on the top right of the portal to request elevated permissions
How can I monitor the power consumption?
Monitoring Power Usage
The easiest way to monitor the power usage of your job is using XDMoD.
Here, the XDMoD entry on this page you can find more general information on XDMoD.
Seeing the power consumption of a specific job:
- Log into XDMoD
- Navigate to "Job Viewer"
- Select your job based on the job number
- Open the "Timeseries" folder
- Select "Node Power"
This will plot the power consumption for each node the job was running on.
Note that there is a time delay of a few hours between jobs finishing and showing up in XDMoD .
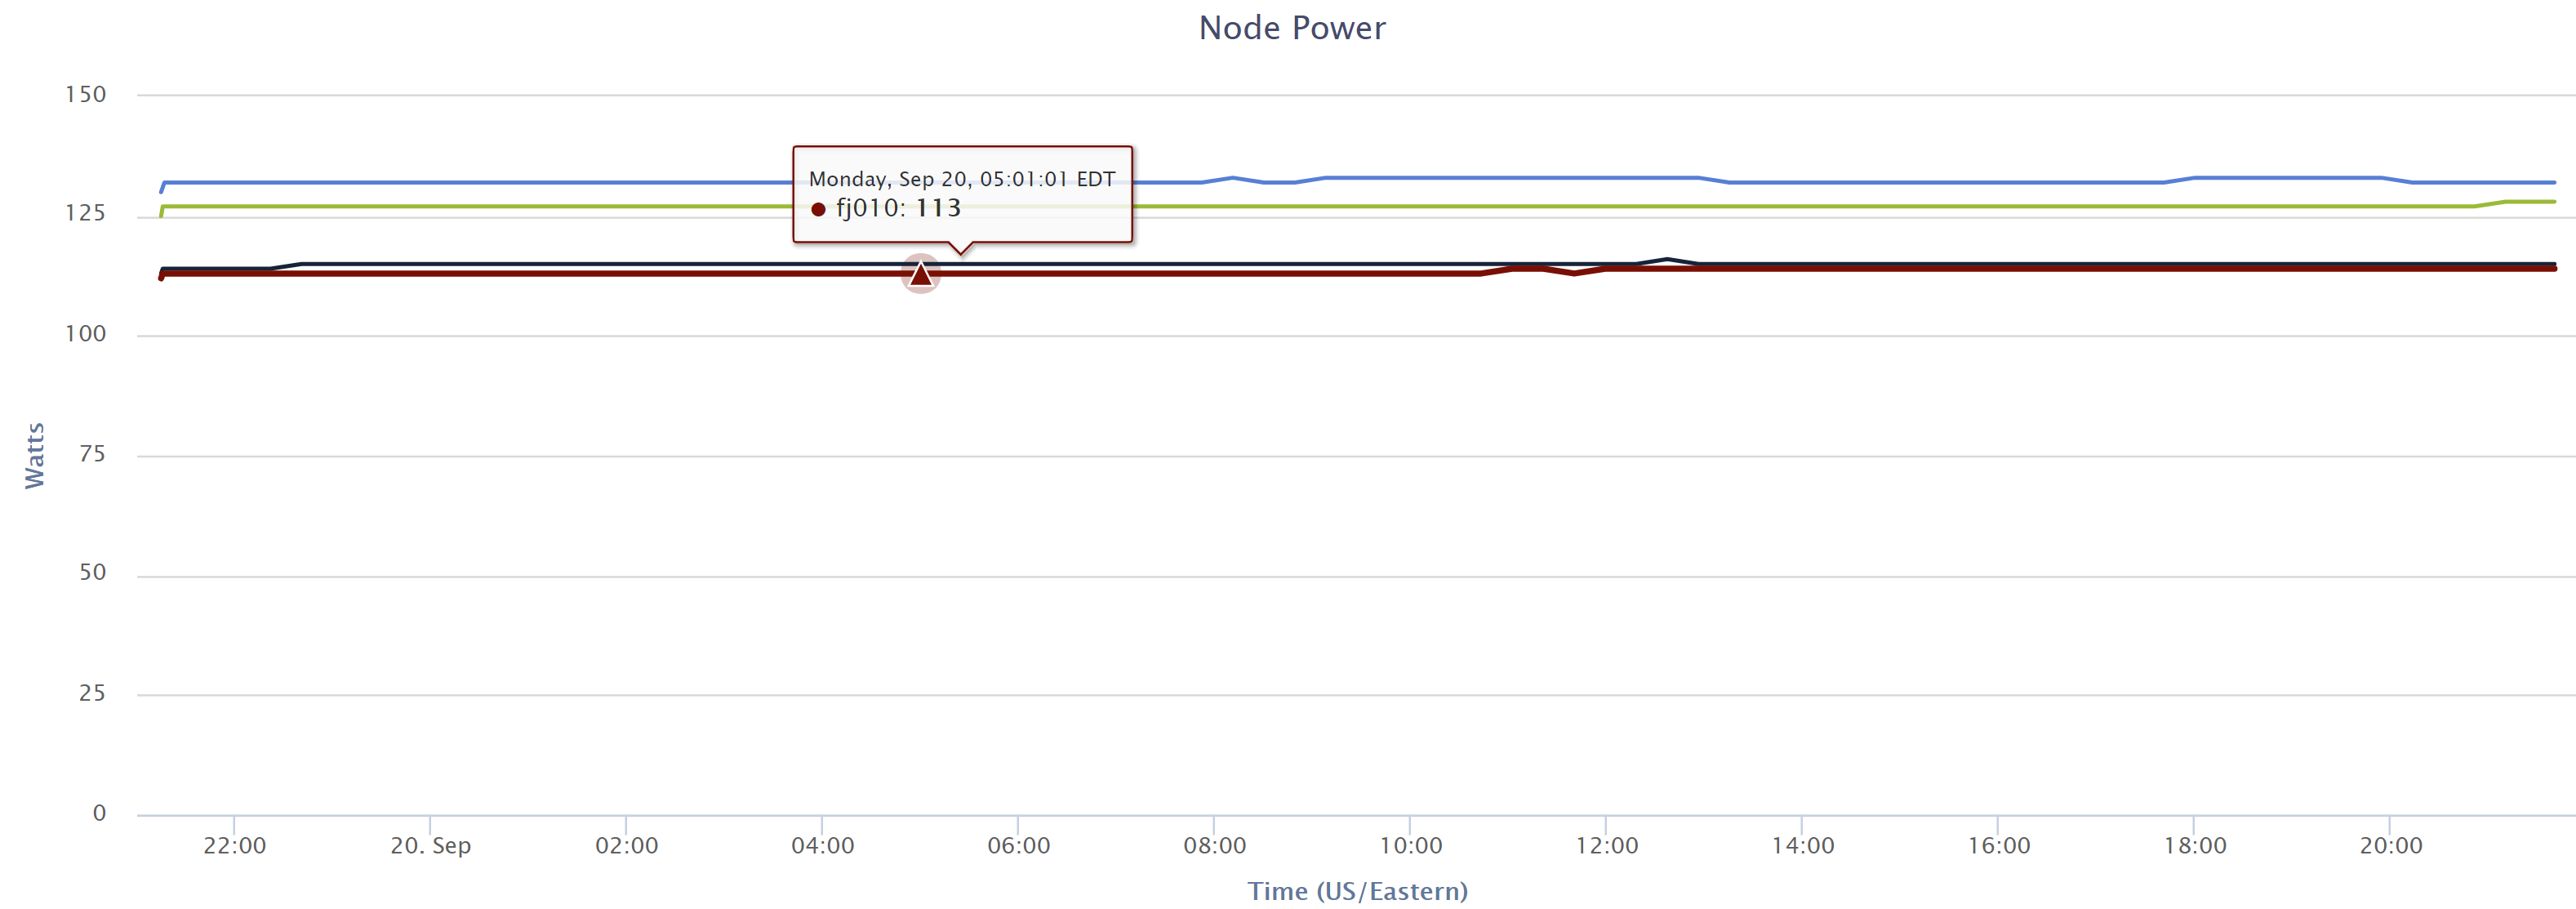
Alternatively, one can measure the power usage using the EA power counters.
Here, the Arm SVE energy training material you can find an example for that provided by Arm. Note that for this the system-wide collection has to be disabled by running the /var/lib/pcp/pmdas/perfevent/perfalloc
command. Hence, you can use it like this:
[esiegmann@fj005 03_energy]$ /var/lib/pcp/pmdas/perfevent/perfalloc &
[1] 2289550

[esiegmann@fj005 03_energy]$ make run-perf
# r11:   CPU_CYCLES: This event counts every cycle
# r1e0:  EA_CORE: This event counts energy consumption per cycle of core.
# r3e0:  EA_L2: This event counts energy consumption per cycle of L2 cache.
#        It counts all events caused in measured CMG regardless of measured PE.
# r3e8:  EA_MEMORY: This event counts energy consumption per cycle of CMG local memory.
#        It counts all events caused in measured CMG regardless of measured PE.
perf stat -x\; -o neon.perf -e duration_time,r11,r1e0,r3e0,r3e8 ./hacc_arm_neon.exe 1000
Maximum OpenMP Threads: 48
Iterations: 1000
Gravity Short-Range-Force Kernel (5th Order): 12823.6 -444.108 -645.349: 1.54061 s
perf stat -x\; -o sve.perf -e duration_time,r11,r1e0,r3e0,r3e8 ./hacc_arm_sve.exe 1000
Maximum OpenMP Threads: 48
Iterations: 1000
Gravity Short-Range-Force Kernel (5th Order): 12823.6 -444.108 -645.349: 1.83943 s
./postproc_perf_energy.py neon.perf -c 8.04 -l 32.8 -m 271
Elapsed Time: 1.28975e+08 ns
Core freq: 1.79841 GHz
Per-core power: 1.82047 Watt
Per-CMG L2 power: 1.73771 Watt
Per-CMG HBM power: 1.85489 Watt
./postproc_perf_energy.py sve.perf -c 8.04 -l 32.8 -m 271
Elapsed Time: 1.1831e+08 ns
Core freq: 1.7988 GHz
Per-core power: 1.8502 Watt
Per-CMG L2 power: 1.74527 Watt
Per-CMG HBM power: 1.8578 Watt
Ookami's network topology
Ookami's Infiniband Topology
Below you can find a diagram of Ookami's inifinband topolgy.
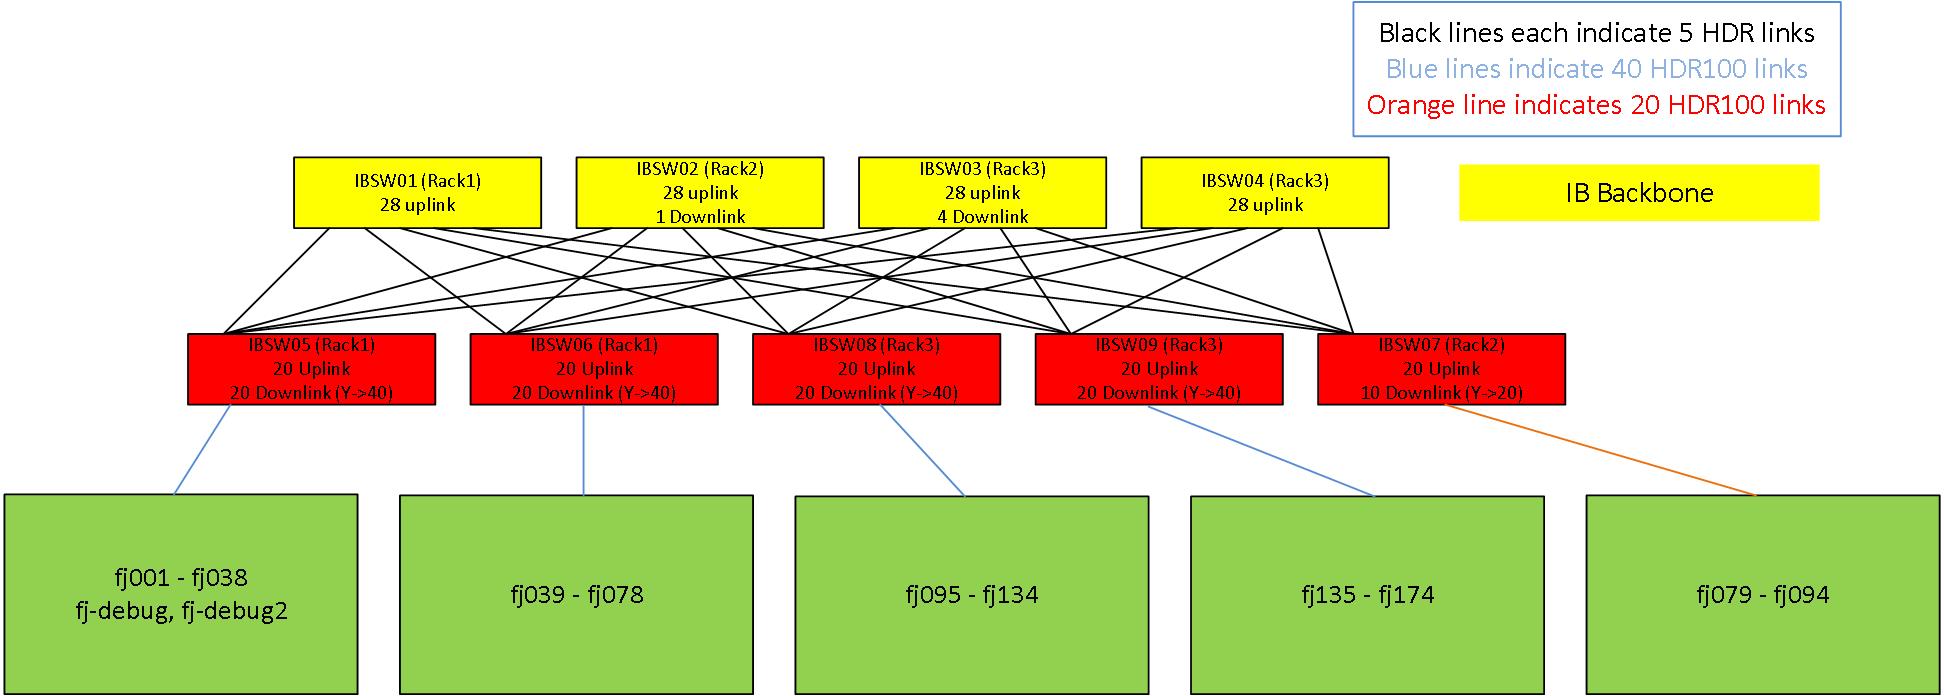
Support and citation
Getting Remote Troubleshooting Help
Remote Assistance Procedure
Please note: the following steps should only be followed after submitting a ticket and being requested to grant remote access by the HPC support team.
For hard-to-solve problems on the Ookami cluster, you can grant the HPC Support team remote access to troubleshoot the issue. This will give us access to a session with your login, allowing us to access your files, and test the issue with your specific environment. You will need the ticket number from an open support ticket. Please be sure to mention in the ticket that you have requested a remote support session.
On Ookami, run the following commands:
module load shared
module load remote-assistance
request-support -t TICKET_NUMBER
This will create a temporary session which the HPC Support team can use to troubleshoot your issue from your account.
You can cancel this session at any time with
request-support --cancel
How to Acknowledge Ookami in Publications
Acknowledging Ookami in Publications
Please acknowledge resources provided by the HPC Support team in publications as follows:
“The authors would like to thank Stony Brook Research Computing and Cyberinfrastructure, and the Institute for Advanced Computational Science at Stony Brook University for access to the innovative high-performance Ookami computing system, which was made possible by a $5M National Science Foundation grant (#1927880).”
Please also share your publication with us, by sending it via email or
Documentation and reference material
Reference material for the A64FX processor, the Arm Scalable Vector Extension and the tools used on Ookami. All links are to the vendor or project site.
Processor and architecture
- A64FX Microarchitecture Manual. Version 1.3.
- A64FX documents, all versions. Manual versions 1.0 to 1.8.1.
- A64FX Specification, Fujitsu HPC Extension. Sector cache, hardware prefetch and the hardware barrier.
Scalable Vector Extension
- Scalable Vector Extensions
- Learn the architecture, Introducing SVE2
- Arm C Language Extensions for SVE. The SVE intrinsics specification.
- Arm C Language Extensions, current specification
- Arm SVE hands-on exercises. From the February 2021 hackathon on Ookami.
- Arm tutorials
Platform and programming environment
- HPE Cray Programming Environment User Guide for Apollo 80. Covers CPE 20.09.
- HPE Apollo 80
Languages and tools used on Ookami
- Chapel
- Julia on Ookami. Material from the December 2022 webinar.
- Codee, formerly Parallelware Analyzer
- Linaro Forge, connecting to a remote system
Wider reading
- Open MPI State of the Union XIII.5. ECP Community BOF Days 2021.
- MPICH for Exascale. ECP Community BOF Days 2021.
- PMIx community events and slides